
| |
| Volume 14, Number 5 | March 21, 2024 |
The Paris Agreement… is an international treaty on climate change. Adopted in 2015, the agreement covers climate change mitigation, adaptation, and finance. The Paris Agreement was negotiated by 196 parties at the 2015 United Nations Climate Change Conference near Paris, France. As of February 2023, 195 members of the United Nations Framework Convention on Climate Change (UNFCCC) are parties to the agreement. …The Paris Agreement's long-term temperature goal is to keep the rise in mean global temperature to well below 2 °C (3.6 °F) above pre-industrial levels, and preferably limit the increase to 1.5 °C (2.7 °F), recognizing that this would substantially reduce the effects of climate change. To achieve this goal, emissions should be reduced as soon as possible and reach net zero by the middle of the 21st century. To stay below 1.5 °C of global warming, emissions need to be cut by roughly 50% by 2030.[1]
The mainstream scientific theory underlying the Paris Agreement is wrong. The present article 1) explains how I know that the mainstream theory is wrong, 2) explains how it has come about that I appear to be the only scientist who knows what exactly is wrong with the mainstream theory, and 3) shows what the correct scientific theory explaining climate change and guiding public policy should be. Participants in the Paris Agreement are unwittingly leading global civilization into great danger. The present article will demonstrate this beyond reasonable doubt. It is of paramount importance that we, Earth's inhabitants, get our climate change theory right.
Before I launch into this topic, I need to address four preliminary matters.
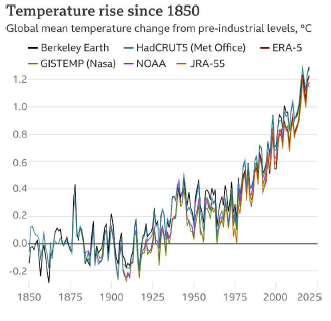
First, present global warming is a real phenomenon (Figure 1). This is not in dispute in this article. The issue is not over whether global warming is happening; it is over what is causing global warming. The answer to this question dramatically affects what should be done about it.
 |
Second, for readers unfamiliar with the term "Bible/science," it is, first of all, not to be confused with creation science, Flood geology, or young-earth creationism. Bible/science is a method of conducting research at the severely neglected interface of the Bible and science which: 1) aims, not to propagandize any ideology, but rather to get at the truth, 2) requires the researcher to hold a high view of both the Bible and science, disparaging neither yet also deifying neither, and 3) is rooted in and insists upon sound chronology, both sacred and secular. In the late twentieth century, by using this method, I was able to correct a major error in traditional biblical chronology, enabling for the first time proper sychronization of biblical and secular history prior to the first millennium B.C.,[2] impacting in an unavoidably radical way such fields as biblical archaeology, earth and planetary science, and aging biology. The present article is an example of the benefit to humanity which Bible/science methodology affords.
Third, I need to clarify the term "mainstream science." It is not to be confused with truth, nor even with an altruistic quest for the truth. The late philosopher of science, Karl Popper, clarified the logic of scientific discovery. Scientific knowledge, he taught, is never final. It advances by bold, frequently impossible-seeming conjectures, followed by winnowing refutations. Subsequently, Thomas Kuhn clarified the sociology of scientific discovery. He showed that the enterprise of science, being a thoroughly human endeavor, can always be depended upon to conform to the dictates of the logic of scientific discovery—once it has exhausted every alternative. Mainstream science is what one finds in scientific journals such as Nature and Science. Mainstream science is as rife today with its own peculiar fads and prejudices as it has always been in the past.
Finally, I need to make explicit the fact that I have no conflict of interest in regard to climate change. My research receives funding neither from the fossil fuel industry nor from the climate change academic–industrial complex. I am a self-published independent research scientist.
Looking back into virtual history[3] 150,000 years (Figure 2), one finds that the climate of Earth appears to be characterized by change rather than by stasis. This figure shows past temperatures relative to present temperature at Vostok, Antarctica. This long record of temperature difference versus time has been derived from ice cores drilled to great depth in the ice sheet covering Antarctica. It shows that the average annual temperature difference at this one location on Earth's surface, reasonably regarded as being representative of the global climate, while stable to within roughly two Celsius degrees for the past roughly ten thousand years (right side of the graph) has fluctuated by as much as 12 Celsius degrees (22 Fahrenheit degrees) previously. Earth's climate appears to be a bit of a contentious beast.
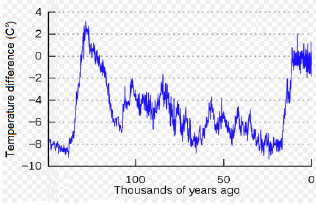 |
This seems surprising when we first learn about it because we tend to extrapolate our personal, limited real-life experience into the past and suppose that Earth's past climate should always have been much the same as we have experienced it to be in our own lifetime. For those who have been privileged to have been afforded the broadening of real-life experience which familiarity with Earth's most ancient written history brings—the history found in Genesis, Exodus, and Deuteronomy—the fact that Earth's climate has changed in the past does not come as a complete surprise. The account found in Genesis chapters 37 through 47 of the widespread seven years of plenty followed by seven years of famine at the time of Joseph comes readily to mind, for example. And the account of the Israelites' passage through the wilderness between their Exodus from Egypt 2450 B.C. and their entrance into the Promised Land 40 years later is found to be peppered with evidences of a significantly more moist climate back then than pertains today.[4] Nonetheless, the degree and complexity of past climate change revealed by Figure 2, and by its extension into even more remote times shown in Figure 3, is still quite breathtaking.
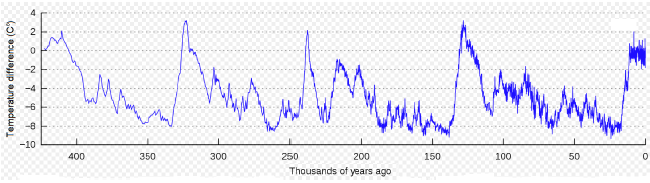 |
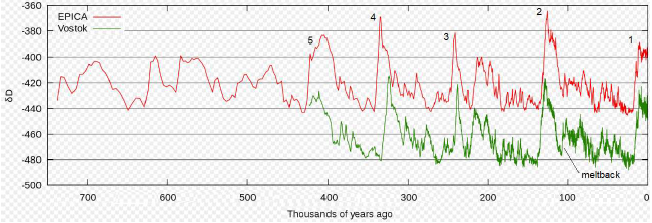
The truly surprising thing revealed by Figure 2 and further emphasized by Figure 3, once one has digested the fact that Earth's climate is naturally highly changeable, is that Earth's climate somehow managed to remain reasonably stable for the past ten thousand years. Similarly stable periods are hard to find looking back over the more than 400,000 years of Figure 3, most especially in the warm temperature range characteristic of the past 10,000 years. The surprise is not that Earth's climate is presently warming—Figure 3 shows that it has done that lots of times in the past—but rather that it has stayed so constant these past ten thousand years.
The rise of modern civilization appears to have coincided with a stable climate anomaly. This immediately suggests the hypothesis that the development of modern, advanced human civilization has been occasioned by this unique interval of relative climate stability. And this further suggests that the knowledge and wealth, stemming from the present population base, made possible by this prolonged climate stability, proffers humanity a unique opportunity to understand Earth's climate properly and to take control of it at this point in history—to tame the beast—for the benefit of present and future generations of Earth's inhabitants.
Be that as it may, these ice cores say—rather forcefully—that there is no reason to expect this stable climate anomaly to persist into the future.
Before moving into a discussion and explanation of the ice-core temperature data we presently possess, I want to tip my hat to all who have played a role in bringing these vital data to the world. To get the Figure 3 data, for example, the Antarctic continental glacier had to be bored to a depth of two miles, and the resulting ice cores had to be retrieved in such a way that a continuous record could be read from the ice for these hundreds of thousands of years. Antarctica is not a very nice place to have to live while working on such a task. And gathering data from the many samples of ice needing to be analyzed from two miles of core to yield such a graph as Figure 3 is clearly no trivial undertaking. I am mindful, as I sit in the comfort of my office analyzing and pondering these ice core data, that they represent sacrifices made by many individuals. Should any of you happen to read this article—from scientist conceiving and overseeing this project, to politician or other government employee allocating the funds, to technician making it happen, …, to taxpayer whose labors make such projects possible—please accept my sincere gratitude for your participation in this important accomplishment.
Figure 3 hints at a quasi-cyclic pattern of warming and cooling. Five conspicuous warming spikes are evident over the past 450,000 years, each separated by roughly 100,000 years, with less pronounced and less regular warming and cooling episodes predating that. What causes this warming and cooling to happen?
The answer to this question arrived at from a Bible/science perspective differs sharply from the answer proffered by modern mainstream science, as will become apparent below. The answer differs because modern mainstream science routinely disparages biblical historical data. It has done so for several generations. This is a prejudicial disparagement, not warranted by the biblical data. Ancient biblical data show themselves to be of highest quality and greatest value to humanity when handled honestly and rationally. The present anti-biblical prejudice has severely hindered the advancement of science. The present article will leave no doubt about this, though climate-change science is hardly the only science which this irrational prejudice has hindered. When biblical historical data are treated fairly, they revolutionize climate-change science.
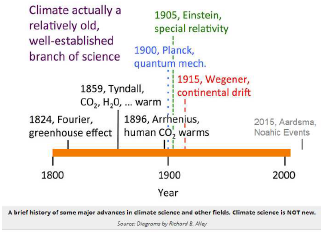
I will use on-line course material made freely available by the Pennsylvania State University as a basis for presenting the particular mainstream view of climate change which appears presently to be driving political policy related to climate change. The course, from which I will be quoting below, is called "Earth 104: Energy and the Environment."[5] The principle instructor is Professor Richard B. Alley. I admire the richness of the multi-media learning experience represented by this on-line presentation. I do not admire the intolerance it displays toward those holding opposing viewpoints.
A more balanced treatment of the subject, better representative of the manner of discourse students should expect from higher education (in contrast to indoctrination), can be found, for example, in another on-line course. This one is by the University of Arizona. It is called "ATMO 336: Weather, Climate, and Society." The principle instructor is Professor Dale Ward.[6]
I know neither Professor Ward nor Professor Alley nor any other professors associated with these e-education curricula. I learned about Professor Alley's course only because of its high ranking on an Internet search engine while I was looking for information on climate change and the Vostok ice core in preparation for this article. I have not gone through the entire course. I have focused mainly on Module 4: "Global Warming – Physics" and Module 5: "Global Warming – History."
Professor Alley's theory of climate change holds natural cyclical variations in Earth's orbit about the sun, called Milankovitch cycles, to be the fundamental cause of climate change cyclicity.
In the ice-house world of the last few million years, Milankovitch cyclicity has driven ice-age cycling.[7]
Over the last millions of years, the brightness of the sun doesn't seem to have changed much, but the Earth's orbit and the tilt of its axis have shifted in regular patterns over tens and hundreds of thousands of years. The orbit changes shape... varying how close and far the Earth gets as it orbits the sun each year.[8]
While the direct climate forcing afforded by Milankovitch cycles is known to be too small to explain past climate change, it is professed to be amplified by positive feedback mechanisms within the climate system. Thus, in this theory, Milankovitch cycles may be said only to instigate and orchestrate climate change. The major amplifier is thought to be greenhouse gases in the atmosphere, most especially carbon dioxide (CO2).
Twenty thousand years ago, 30% of today's land area was covered by great glaciers, which locked up so much water that the global sea level was almost 400 feet lower than today. Then, as Earth's orbit changed, temperatures and CO2 rose, and the glacier melted back. The orbits set the stage, but by themselves, they weren't enough. We need the warming and cooling effects of rising and falling CO2 to explain the changes we know happened.[9]
A lot of very interesting questions are not fully answered with regard to the ice ages. But, the big picture is clear. The ultimate cause is tied to Milankovitch orbital features, which change the total amount of sunshine reaching a place during a season by 10-20% or even more (although with tiny globally-averaged effect). Many things happen in response to this cause, and carbon-dioxide response is especially important in the global signal.[10]
Thus, the mainstream theory currently driving political policy centers on 1) Milankovitch cycles and 2) carbon dioxide.
By way of general assessment, my view, as a scientist, is that this mainstream theory lacks scientific cogency. Its persuasiveness comes not from the circumstantial evidences presented to support its claims but rather from the apparent lack of any better theory. As a result, the Bible/science theory presented below—the Noahic Events theory of climate change—automatically severely undermines this mainstream theory.
But I want to move immediately to the heart of the matter, as it is this which really demands our attention.
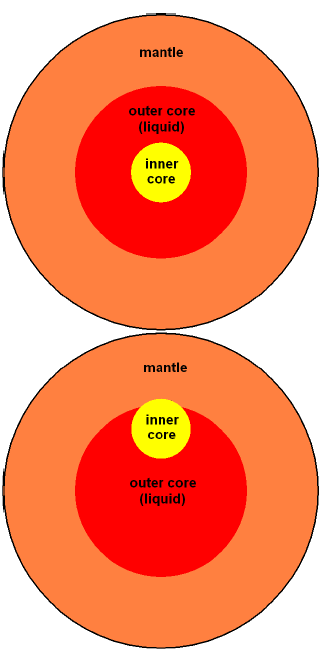
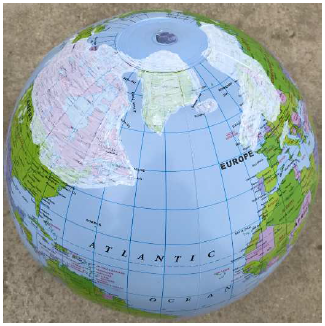
According to what we learn about Earth's history when using a rigorous Bible/science methodology, the fundamental thing which is wrong with the mainstream theory of climate change presented above is that it fails to take into account the fact that Earth's solid inner core is in no way fixed to its normal central position. According to what we learn from the biblical historical record of Noah's Flood, when it is investigated scientifically, Earth's inner core was dislocated from center to the mantle (Figure 4) at the time of the Flood. According to what we learn from ice cores (see below), this has happened repeatedly in virtual history. When the inner core is dislocated to the mantle, it necessarily produces a global natural disaster.
 |
I call these natural disasters "Noahic Events" in honor of Noah, whose recorded real-life, eye-witness observations of the most recent one can be found in the biblical book of Genesis, chapters 6 through 9. According to both biblical chronology and radiocarbon dating, this Noahic Event happened 3522±12 B.C.[11] The discovery of these Noahic Event natural disasters resulted from a protracted Bible/science investigation into the physical cause of Noah's Flood, beginning in 1997[12] and culminating in publication of the 380-page book Noah's Flood Happened 3520 B.C. in 2015, detailing what had been discovered to that point, including Noahic Events. This book is necessary reading for anyone wishing to critique the present Bible/science theory of climate change or simply to understand it better. I will be drawing from it extensively in this article, generally without providing specific citations to it. The book is freely available from my website, www.biblicalchronologist.org.
Take particular note that the following theory, explaining Earth's temperature fluctuation data, can be falsified by showing that Earth's inner core can in no way be dislocated from center. Simply solve the physics of the motion of the solid inner and the outer fluid core to show that the restoring force acting on the inner core cannot be overcome by any real-world externally applied force to falsify the Noahic Events theory of climate change.
On the flip side, failure to falsify the foundational premise that Earth's inner core has repeatedly been dislocated from center inevitably entails a revolution in geophysics, before which much of currently-mainstream Earth-science theory, including the above mainstream theory of climate change, will inevitably be swept away (Figure 5).
 |
Noahic Events are the missing heart of the matter for the mainstream theory.
A Noahic Event is comprised of three phases:
a trigger event, during which Earth is subjected to a suitable thrust, perturbing the inner core slightly off center,
core collapse, during which the inner core is ejected from center, ultimately to collide with the mantle, the whole collapse driven by gravitational potential energy as Earth's radius shrinks inward, and
a ponderous rebound, during which the inner core is restored to center.
Noahic Events, even at this early stage of their investigation, already explain too much to be brushed aside. They explain, quantitatively, Noah's observations of the Flood. And they provide easy answers to most, if not all, of the big mysteries plaguing modern geophysics.[13] Here are a few quick examples.
In a Noahic Event, the inner core collides forcefully with the underside of the mantle. This explains for the first time why Earth's crust should be found to be fractured into plates.
In Noah's case, the collision occurred beneath Iceland. The fact that Noah's ark landed atop a mountain in Turkey pinpoints this location. The fact that this tectonic collision happened just five and a half thousand years ago explains why Iceland is so volcanically active today.
Displacement of the inner core to the mantle substantially changes Earth's center of gravity. As a result, objects at Earth's surface experience a gravitational attraction significantly offset from Earth's center toward the displaced inner core. Fluids such as oceans and the atmosphere, which are not rigidly fastened in place on the surface of the earth the way mountains and trees are, flow over the surface toward the displaced inner core. In Noah's case, the displacement of the inner core to the mantle beneath Iceland caused the oceans of the southern hemisphere to flow up into the northern hemisphere. This caused a flood which submerged most of the land in the northern hemisphere while exposing the seafloor around Antarctica. This was Noah's Flood. The water of Noah's Flood heaped up to great depth in the north, centered on Iceland. It stayed heaped up at full depth, Noah recorded, for 110 days before beginning to recede.
In the Noahic Event which Noah witnessed, it took 40 days for the inner core to travel from the center of the earth to the mantle. We know this from the 40 days and nights of rain which Noah recorded. Not only the oceans, but the atmosphere too, necessarily flowed to the north and heaped up there during this 40 days. When air is elevated in the atmosphere, it cools and loses moisture as rain. The overall elevating and consequent cooling of much of the atmosphere as it heaped up in the north is why Noah observed 40 days and nights of rain. The lowering back down of the atmosphere after the Flood, as it returned to normal, naturally produced a katabatic wind, which Noah observed and recorded drying the ground as the Flood receded.
Noahic Events provide both the energy and the forces needed to drive plate tectonics. During a Noahic Event, the earth ponderously collapses inward due to the loss of the solid inner core from center and the compressibility of the outer core fluid which replaces it. This releases enormous gravitational potential energy. There follows a ponderous rebound. This "breathing mode" oscillation of the whole earth causes Earth's surface area to shrink during the collapse, and then to expand back again during the rebound. It is the forces set up by this changing surface area which drive plate tectonics.
These breathing mode oscillations are the cause of Earth's magnetic field. (There is no geodynamo driven by inner core fluid convection.) Earth's magnetic field is set up by simple Faraday induction. As the earth shrinks, established magnetic field lines are cut by conductive inner core fluid, generating electric currents which source new magnetic field. During the rebound, the same thing happens in reverse, generating new magnetic field in the opposite direction. The sum of these two large fields leaves a net residual magnetic field. Whether the residual field will be normal or reversed will depend on the details of each individual Noahic Event.
With no sustaining geodynamo, the residual field should simply decay with time between Noahic Events. This is what Earth's magnetic field has been observed to be doing since it began to be monitored by Gauss in 1832.
The origin of the moon finds explanation as having fissioned from Earth in a very early Noahic Event, when Earth was more massive (containing the mass of both Earth and the moon) and spinning much faster, the inner core was smaller, and the mantle was hotter and more easily penetrated by the inner core. During its penetration of the mantle, the inner core would have vaporized explosively, due to reduced pressure. The fissioned debris from this explosive penetration ultimately formed the moon.
There is more—much more—but let me get back to the task at hand of explaining the climate change revealed by Earth's ice cores. It, too, finds a ready explanation in terms of Noahic Events.
According to the Noahic Events theory of climate change, Earth's climate and climate change result predominantly from the titanic struggle between Earth's glaciers and Earth's Noahic Events. Here is the gist of this theory.
Earth's average annual temperature is predominantly controlled by its reflectivity (i.e., its albedo).
Earth's average annual reflectivity is predominantly controlled by the amount of surface area covered by its polar and alpine glaciers.
The equilibrium state for the Sun–Earth system, given the present land area configuration, is large glaciers and cool temperatures.
Noahic Events disrupt the growth of the glaciers toward this equilibrium state by melting the glaciers back, causing delayed, episodic global warming.
Earth's surface is heated by the radiation it receives from the sun. Solar radiation can heat Earth's surface only if it is absorbed by Earth's surface. If the incoming radiation is reflected back out into space, it will not heat Earth's surface.
Snow is very good at reflecting solar radiation back out into space. Climate change results, in this theory, from the growth and regression of Earth's glaciers changing the amount of solar radiation which is reflected back out into space. Growing glaciers result in cooling because more solar radiation is being reflected back out into space. Shrinking glaciers result in warming because more solar radiation is being absorbed by Earth's surface.
The equilibrium state for the Sun–Earth system, given the present land area configuration, is large glaciers and cool temperatures. Earth's glaciers want to grow large and the global temperature wants to go cold. But something keeps episodically melting the glaciers back. According to the Noahic Events theory of climate change, Noahic Events cause this meltback.
In this theory, Milankovitch cycles play no role. The quasi-periodicity of warming events seen in Earth's ice core temperature records is not due to astronomy. Rather, it is due to volcanology.
In this theory, atmospheric carbon dioxide concentrations play but a minor role, ignorable in first approximation.
In this theory, present global warming is not causing the glaciers to melt. Rather, the last Noahic Event (i.e., Noah's Flood) is, after a predictable delay, causing the present recession of glaciers, reducing Earth's reflectivity and thereby causing present global warming.
Physics teaches us three things about Earth's temperature which are fundamental to understanding Earth's climate.
Earth naturally wants to cool down.
Radiation from the sun is what keeps Earth warm.
Changing the amount of solar radiation reflected back out into space will change Earth's temperature.
Earth is an object in space, heated by radiation from the sun. An object in space, shielded from the sun, becomes very cold very quickly. This is because objects in space lose heat by blackbody radiation, and blackbody radiation increases as the fourth power of temperature. This is a very strong temperature dependence, with the result that objects in space not heated by the sun cool down very quickly. The surface of the moon can heat up to 120 C (250 F)—hot enough to boil water—during the lunar day, but during the lunar night, the moon's surface quickly plummets to below -130 C (-208 F). If we were to cover the whole surface of the moon with mirrors, reflecting the incoming solar radiation back out into space, then the whole surface of the moon, day and night, would drop to below -130 C.
As an object in space, Earth requires a continuous supply of solar radiation to keep it warm. Incoming solar radiation needs to be absorbed by Earth's surface to heat the surface, which heats the air above the surface. Covering Earth's surface with snow is similar to covering the surface of the moon with mirrors. The snow reflects incoming solar radiation back out into space, causing Earth's temperature to cool down. For this reason, Earth's average global surface temperature increases as polar and alpine glaciers shrink, and it decreases as they grow. This is the cause of the large temperature fluctuations recorded in the Antarctic ice cores. Shrinking of the surface area covered by glacier ice is the cause of presently observed global warming.
Glaciers exist in Earth's polar regions because these regions are cold. Earth's equatorial regions are warm because solar radiation shines down on these regions each day from pretty much directly overhead. Earth's polar regions are cold, snow or no snow, because solar radiation comes into these regions only at a large slant each day, reducing solar radiant energy received per square foot of surface area relative to equatorial regions. Said simply, the polar regions get less warming from the sun than equatorial regions.
Heat naturally moves from warmer to colder regions. Heat moves from warm equatorial regions to the poles via Earth's atmosphere and oceans. In the atmosphere, heat is carried from the equator to the poles via winds. In the oceans, it is carried via ocean currents.
The South Pole is covered by a large landmass, Antarctica. Heat can get to the South Pole, located in the interior of Antarctica, only through the atmosphere. The North Pole is covered by a sea, the Arctic Ocean. Heat can get to it both by winds and by ocean currents. For this reason, the South Pole is much colder than the North Pole.
Because the South Pole is much colder than the North Pole, glaciers are easier to melt at the North Pole than at the South Pole.
Physics teaches us two important things about glaciers which are foundational to understanding climate change.
Glaciers are thick slabs of ice covering many square miles of surface area. Thicknesses can reach two or even three miles. This thickness results from snow falling on top of the glacier year after year. The weight of the accumulated snow compresses deeper snow into ice. The weight of snow and ice causes deeper layers to thin and slowly squeeze out the sides.
The first important thing physics teaches us about glaciers is that they are naturally inclined to grow.
Imagine a modern Earth initially having no glaciers. Earth's reflectivity is at its lowest point in such a case, so global average temperature is at its highest point. Nonetheless, the polar regions still have average temperatures which are cold enough to begin to accumulate snow on land surfaces year by year.
For simplicity, 1) focus on just the south polar region, 2) pretend that Antarctica is a perfectly circular cap centered on the South Pole, and 3) pretend that Antarctica is a vast plain with no mountains. In this hypothetical example, snow builds up in the interior of Antarctica year by year, centered on the South Pole. But the coastal regions of this Antarctica are warmer than the interior because the surrounding ocean brings heat in to them from the equatorial regions, so no snow builds up there. Each summer, the snow which falls there gets melted away.
After some thousands of years, the snow in the interior has produced a mound of snow and ice which is say a mile thick and some hundreds of miles in radius—a relatively small circular glacier centered on the South Pole. There are three effects of this new glacier which encourage its further growth:
The glacier reflects sunlight falling on it, increasing Earth's total reflectivity, thus decreasing Earth's global average temperature. This effect is small initially because the warming effect of the sun is relatively small at the poles. But this effect increases as the glacier grows, ultimately becoming a continental glacier (i.e., an ice sheet).
The ice begins to squeeze out radially (i.e., to flow) because of the great weight of accumulated snow and ice, mechanically increasing the surface area of the glacier.
The advancing ice sheet perimeter increases the altitude at which snow accumulates at that radial distance from the South Pole. Because temperature decreases with altitude in the atmosphere, snow which previously fell on the ground and melted away each summer at that radial distance, will now fall on the ice sheet at a much higher altitude and not melt away each summer.
This idealized, hypothetical example teaches us that glaciers are naturally inclined to grow. The natural consequence of these three effects is that this example Antarctic glacier will continue to spread out and thicken until ice covers Antarctica two or three miles deep, similar to what is observed in Antarctica today.
The second important thing physics teaches us about glaciers is that if something begins to melt them, causing them to thin, they do not resume growing where they left off once the melting has ceased.
To see this, imagine that our example glacier has grown big enough to cover half the surface area of our idealized Antarctica to a depth of one mile. Now imagine that it gets melted by being submerged by ocean water for some months so that, while the ice sheet still covers half the surface area of Antarctica, it is now only a half mile thick. What will this do?
First, most importantly, notice that this does not appreciably change Earth's temperature. It does not appreciably change Earth's temperature because it does not appreciably change Earth's reflectivity. Other than relatively slight meltback of the edge wall of the glacier, exposing a relatively small amount of ground and thus slightly decreasing Earth's reflectivity, the ice is still covering pretty much the same surface area as before it was melted back. Most of the melting has thinned the glacier, not reduced its radius, and a glacier reflects sunlight pretty much the same whether it is thick or thin.
The main consequence of melting is not an immediate change in temperature but rather that the glacier is no longer able to grow radially. Melting has removed much of the great weight of overlying ice which previously drove radial growth. So Earth's temperature, which had been trending colder year by year due to ever-increasing reflectivity as a result of radial growth of the glacier prior to its melting, stabilizes immediately following the melting event.
Now, the glacier will not be able to resume growing radially for some thousands of years. It must wait for a sufficient weight of new snow to accumulate on top of it to get it moving again. Meanwhile, the altitude at which the new snow is accumulating has significantly reduced, raising the temperature at which the new snow is accumulating by some tens of Fahrenheit degrees all across the glacier. So there will be a net loss of snow and ice out where it is naturally warmer toward the perimeter of this melted-back glacier year by year. Near the pole, the melted-back glacier will thicken year by year, but it will thin year by year out toward the perimeter. Eventually, the perimeter ice will thin to zero. At this point, some thousands of years after the meltback event, Earth's reflectivity suddenly begins to reduce, and Earth necessarily begins suddenly to warm.
This warming trend will continue for some years until the geometry of the glacier has come to the place where the glacier can resume its radial growth, yielding a net increase in the surface area it is covering up once again.
This teaches us that the warming caused by melting back a glacier does not take place immediately, but rather is delayed relative to the melt-back event by some thousands of years.
Physics teaches us that the present global warming trend is a predictable result of the melting back of the glaciers of Earth's northern polar regions by Noah's Flood five and a half thousand years ago.
There are two things of importance to the present topic to be learned from the physics of Noahic Events.
First, Noahic Events, for reasons explained above, cause flooding with ocean water over roughly half of the planet, reaching a maximum depth of roughly 8,800 meters (5.5 miles) above mean sea level. As a result, they have potential to melt glaciers back significantly. Thick glaciers, like the one covering Greenland, have potential to break free of their beds and float, melting back their underside and potentially relocating them. Thinner glaciers lack sufficient buoyancy to break free of their beds and are melted back from the top.
Glaciers on Devon Island and Ellesmere Island in northern Canada are examples of thinner glaciers. They were both significantly melted back from the top by Noah's Flood. The chronology of the Devon Island glacier is particularly well established, being based on annual ice layer thicknesses. The date of its being melted back coincides with the date of Noah's Flood, 3520 B.C., established by biblical chronology and corroborated by radiocarbon dating.[14]
The Devon Island glacier was roughly 300 meters thick when cored in 1972 and 1973. Most of this thickness was due to new ice which had formed since Noah's Flood. The Devon Island glacier appears to have lost 250 meters or more from its pre-Flood thickness due to its submergence by ocean water at the time of Noah's Flood. It still preserved, in its bottom 13 meters—having δO18 values discontinuous with the overlying post-Flood ice—a record of the rapid warming at the start of the presently ongoing deglaciation. The Agassiz glacier on neighboring Ellesmere Island, a yet thinner glacier, was similarly melted back—displaying δO18 values severely discontinuous with the overlying post-Flood ice—but evidently to much earlier times as it preserved no trace of the present deglaciation.
The second thing of importance to the present topic to be learned from the physics of Noahic Events is that their occurrence will display a natural periodicity.
Noahic Events leave behind a unique antipodal hotspots signature. The trigger results from a volcano (the first hotspot) producing a thrust on one side of the earth, ultimately yielding a collision of the inner core with the underside of the mantle on the opposite side of the earth. Thus the trigger-volcano hotspot on one side of the earth produces an antipodal collision-induced hotspot at Earth's surface on the other side of the earth. For Noah's Flood, Iceland is the collision-induced hotspot, as previously mentioned. The antipodal trigger-volcano hotspot is Balleny Islands, off the coast of Antarctica.
Jonathan Hagstrum, seeking to understand the origin of antipodal hotspots, published a list of them.[15] Iceland–Balleny Islands is the third entry in his list. The list includes ten additional antipodal hotspot pairs of "primary" (i.e., most prominent) hotspots. Thus, Noahic Events are not limited to Noah's Flood and are not restricted to the Iceland–Balleny Islands antipodal hotspots. Noahic Event flooding will necessarily be centered on the geographical location of the collision-induced hotspot member of the antipodal hotspots pair producing the Noahic Event.
Many volcanoes, even very big volcanoes, do not trigger inner core dislocation and core collapse. Trigger-volcanoes are thus in some way unique. In devising a trigger-volcano model, one should not simply assume that accepted ideas of conditions inside the earth are valid, as Noahic Events have potential to overturn assumptions foundational to the derivation of the supposed conditions inside the earth. Details of the nature of trigger-volcanoes are still uncertain but the basic idea seems clear enough. The present model pictures trigger-volcanos as fundamentally a means by which (radiogenic and/or primordial) helium and/or argon gas originating in the core is vented from the core–mantle boundary where it is otherwise trapped. In the simplest model, the trigger-volcano pipe plugs with outer core fluid following an eruption. The plug is then slowly (thousands of years) displaced from the bottom of the pipe to the top of it by newly accumulated gas until the volcano erupts once again. Venting of the accumulated gas is pictured as protracted (days), during which the volcano functions essentially as a rocket engine, accelerating Earth in space. This acceleration produces a transient toroidal circulation of fluid in the outer core sufficient to nudge the inner core off center. Core collapse inevitably follows.
This trigger-volcano model predicts a natural periodicity of eruptions for any given antipodal pair. The pipe plugs, the plug is slowly mined (melted) away by new hot gas, the volcano erupts venting the gas, and the pipe plugs again, starting the cycle over again. It further predicts that the length of time from one eruption of a trigger volcano to its next eruption (i.e., its period) will be similar for all antipodal pairs. This is the characteristic time it takes to displace a plug extending from the top of the liquid outer core to the crust.
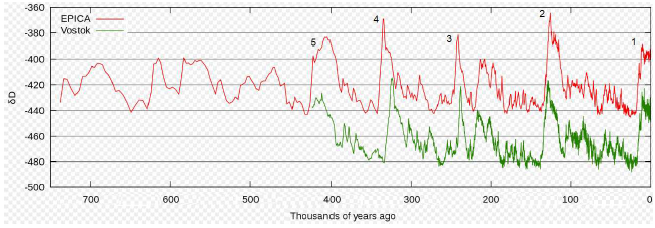
Natural growth of glaciers with episodic meltbacks due to Noahic Events explains with relative ease the climate variability exhibited by the temperature difference records from Antarctic ice cores (Figure 6). The following is a simple, first-approximation explanation. It illustrates the basic idea. It is not quantitatively correct, for reasons which will become apparent eventually below.
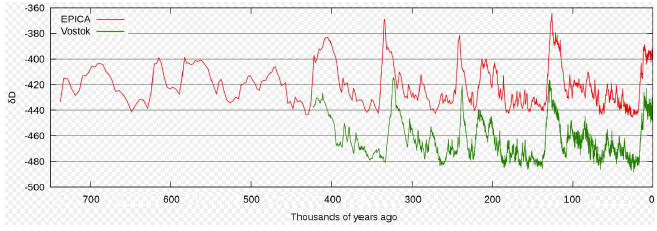 |
There appear to be roughly ten active antipodal hotspot pairs. These appear to trigger independently of one another, each with a period close to 100,000 years. (As just mentioned, this will turn out not to be quantitatively correct, but go with it for now to get the basic idea.)
The large-amplitude, relatively narrow, rapid-warming peaks in the past 350,000 years can be explained by nearly simultaneous triggering of three antipodal pairs that cause three nearly simultaneous Noahic Events. The underlying cause of the observed roughly 100,000-year periodicity for these large-warming episodes then becomes the roughly 100,000-year periodicity of individual antipodal pairs.
To illustrate, imagine three antipodal pairs having periods of 97, 100, and 107 thousand years respectively. Label these pairs #97, #100, and #107. Suppose these three triggers happened, by chance, to nearly coincide 240,000 years ago. This would give a resultant heat spike which was tall and narrow, like the spike in Figure 6 at 240,000 BP. The next spike will occur roughly 100,000 years later, but it will be fatter because #97 will trigger first, 97,000 years later, at 143,000 BP, #100 will trigger next, at 140,000 BP, and #107 will trigger last, at 133,000 BP. This gives a fatter peak, like the one in Figure 6 at roughly 125,000 BP. The next cycle will yield an even fatter peak, like the one in Figure 6 which is presently underway.
The same spreading out of triggers and consequent broadening of heat spikes happens going farther back in time, starting from the 240,000 BP hypothetical coincidence, yielding peaks which mirror those found going forward in time. Figure 6 shows this property as well. The peak at roughly 335,000 BP is most similar to the peak at roughly 125,000 BP, and the peak out beyond 400,000 BP is most similar to the peak presently underway.
Going back even farther in time, past 450,000 years, the triple near-coincidence is effectively lost, being too spread out to produce large-amplitude warming peaks. This explains the more rounded character and less regular pattern of warming peaks in the EPICA record prior to 450,000 years ago.
This provides a simple explanation of the overall character of the ice-core temperature difference records. I now want to focus on just the past roughly 25,000 years.
It is possible to reconstruct with reasonable confidence which antipodal pairs triggered and when they triggered, resulting in this most-recent warming event (Figure 7). This had to be figured out starting with the final Noahic Event, Noah's Flood, but it is easier to explain what happened working forward in time.
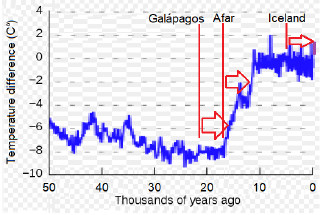 |
Galápagos–Afanassy Nikitin, the sixth entry in Hagstrum's list, triggered first, about 22,000 BP. It was followed by Afar–Marquesas, the second entry in Hagstrum's list, roughly 17,000 BP. It was followed by Iceland–Balleny Islands (Noah's Flood, mentioned previously) 5,470 BP. The rapid warming due to this latest Noahic Event appears now to be in progress.
Figure 8 shows the extent of glaciation just prior to the last deglaciation.
 |
The deglaciation began with the Galápagos Noahic Event, roughly 22,000 BP. It melted back (thinned) much of the continental glacier covering Canada and northern United States (Figure 9), as well as the alpine glaciers of Chile and Argentina in the southern hemisphere.
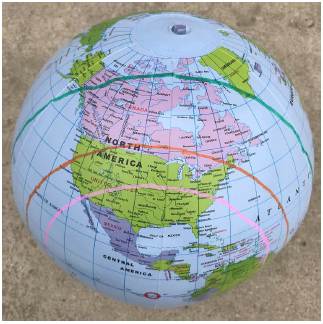 |
The small red circle in Figure 9 shows where the collision-induced hotspot is located, directly beneath which the inner core collided with the underside of the mantle.
The pink circle shows flooding to a depth of approximately 5,000 meters (3 miles), the orange circle shows flooding to a depth of approximately 3,000 meters (2 miles), and the green circle shows flooding to a depth of approximately 1,000 meters (0.6 miles) above mean sea level. For comparison, Canada has an average elevation of 487 meters.
Global warming from the Galápagos Noahic Event commenced roughly 17,000 BP (Figure 7) and carried on until about 14,000 BP. The result was an increase in average temperature at Vostok of about 4 Celsius degrees.
The Afar Noahic Event melted back (thinned) much of the continental glacier covering western Europe (Figure 10 and Figure 11). As a result, a second episode of global warming commenced roughly 12,000 BP (Figure 7) and carried on until about 11,000 BP, ultimately raising average annual temperature at Vostok another roughly 3 Celsius degrees. This inaugurated the era of warm Earth temperatures which we presently enjoy.
 |
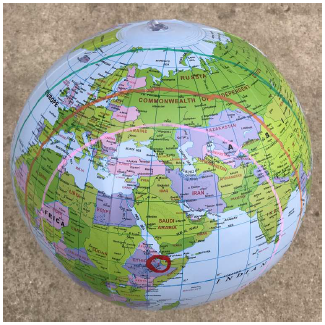 |
The glaciers had been recovering from the Afar meltback for roughly 11,500 years when the Iceland (Noah's Flood) Noahic Event struck (Figure 12). Because of Iceland's location in the high north, Iceland Noahic Events have the greatest potential impact on the glaciers of the north. They have potential to melt back the Canadian continental glacier and the western European continental glacier at the same time. The Greenland ice sheet largely escapes both Galápagos Noahic Events and Afar Noahic Events. It does not escape Iceland Noahic Events.
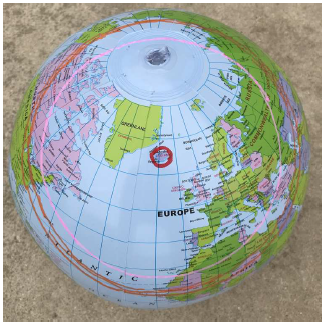 |
Noah's Flood melted back northern glaciers, including the Greenland ice sheet, 3520 B.C. The melted-back glaciers have been in retreat ever since. At present, they are no longer just thinning out near their perimeters. They are now shrinking in size as well. Their present extent is shown in Figure 13.
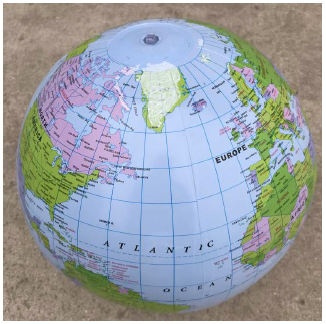 |
The consequent modern decreased reflectivity and resulting rapid global warming appears to have increased average annual temperature at Vostok by about 1.2 Celsius degrees since 1950 A.D. Based on the four previous clusters of Noahic Events from what appears to be these same three antipodal hotspots pairs, the present warming seems likely to raise the average annual temperature in Antarctica another 1 or possibly 2 Celsius degrees over the next century or two.
Before leaving this section, notice that the advent of the Iceland Noahic Event (Noah's Flood) explains the unique past 10,000 year temperature stasis. The first 5,000 years of this stasis followed the Afar warming episode. This first 5,000 years of stasis, as the Earth climate system ponderously stopped warming and began to adjust back toward cooling, is not surprising. The second period of 5,000 years is what requires explanation. It seems highly likely that Earth's climate was on the verge of beginning to cool again after the first 5,000 years of stasis. But then the Iceland Noahic Event struck. This halted the newly recovered glaciers in their tracks once again, inaugurating another 5,000 years of stasis.
The derivation of Figure 7 requires some comment. As mentioned above, it was necessary to start with Noah's Flood and work back from there. Here is how that was done.
The assignment of the Iceland hotspot to Noah's Flood and the date when this Noahic Event happened were both known to me from my previous years of research into Noah's Flood. Their derivations are documented in Noah's Flood Happened 3520 B.C. The discussion showing that rapid warming will be delayed some thousands of years following a Noahic Event meltback is new with this article. The length of the delay between meltback and onset of rapid warming is known for the Noah's Flood case only. Based upon presently observed global warming, which starts to become conspicuous only after 1980, one finds a delay of (3520 + 1980 =) 5,500 years. This delay has been used to estimate the dates of occurrence of the Galápagos and Afar Noahic Events in Figure 7. The use of this delay time is corroborated by the fact that it places the Galápagos Noahic Event at a transition from cooling to stasis, evident in Figure 7, as predicted by the earlier discussion of the physics of Earth's glaciers.
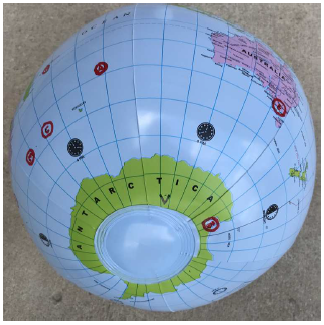
The next task for construction of Figure 7 was to figure out which antipodal pair was responsible for each of the two initial rapid warming events. The biggest constraint on these two choices was that the antipodal pairs involved could not result in significant lowering of the ocean surrounding Antarctica. The Iceland (Noah's Flood) Noahic Event did significantly lower the ocean surrounding Antarctica. In fact, it exposed the seafloor around Antarctica (Figure 14). (If you are unfamiliar with my Bible/science research into human aging, and if your heart is already racing, or if you already feel a bit dizzy, you should sit down at this point.) The two initial Noahic Events could not significantly have exposed the seafloor because human life spans prior to Noah's Flood were much longer then than they are at present.[16] If the two initial Noahic Events had exposed the seafloor around Antarctica, then life spans prior to the Flood would already have been at modern levels.
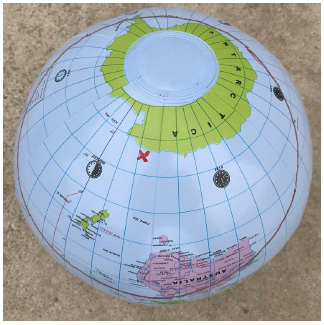 |
To get water deep enough to melt back northern glaciers, one needs northern Noahic Events. But if these Noahic Events are too far north, they will expose seafloors around Antarctica.
Iceland is one of four collision-induced hotspots (Figure 15) from Hagstrum's list which are well-positioned to melt northern glaciers. All four of these cause substantial loss of ocean depth around Antarctica, excluding them as candidates for the initial two Noahic Events responsible for the presently ongoing deglaciation. (This does not exclude them from activity at other times, of course.)
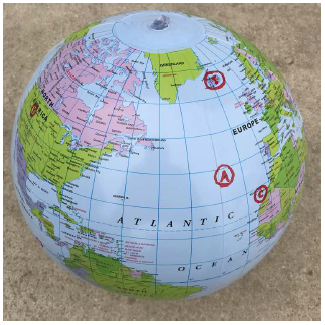 |
Only two northern collision-induced hotspots from Hagstrum's list remain: Galápagos Islands, on the equator, and Afar, 11 degrees north of the equator. This is how these two were chosen for Figure 7.
Galápagos was chosen as the first Noahic Event because of its potential to clear ice from a larger surface area farther south, yielding a greater loss of reflectivity where it most counts and thus a greater overall warming than seems likely from the Afar meltback.
There is cause for alarm at present, but not from climate change or global warming. Ultimately, warming will stop and, probably many centuries hence, cooling will begin again as the glaciers get back on their feet and begin to advance once again. But none of this is cause for any alarm.
Carbon dioxide emissions are also not a cause for alarm. They are not driving present global warming. Meltback-induced recession of glaciers is. If carbon dioxide emissions were totally eliminated at present and the atmosphere scrubbed back down to pre-industrial levels of carbon dioxide, retreat of glaciers would still continue, and global warming would carry on until the temperature rise typical of these once-per-hundred-thousand-years triple-Noahic-Events deglaciations had been achieved. The present deglaciation is still in progress. Past deglaciations teach us that this present deglaciation still has another one or two Celsius degrees of warming to go. The whole notion of carbon dioxide emissions being a cause for alarm is a red herring.
The cause for alarm is the catastrophic impact the next Noahic Event will have on civilization. You cannot flood half the globe and remove air and water from much of the other half and not wind up with most of humanity dead. This is precisely what happened in Noah's Flood five and a half thousand years ago. The significantly advanced civilization of that long-ago day was completely wiped out by the Flood. A small remnant of survivors had to start over again, pretty much from scratch, once the Flood had ended.
The proper alarm to be focused on at present is the next Noahic Event.
How much time do we have to prepare for the next Noahic Event? When might we expect the next one to happen?
I will use the combined EPICA and Vostok ice cores temperature graph shown previously as Figure 6 to make a first quantitative effort at answering these questions. As a first step, I want to determine the frequency of Noahic Events. This will not succeed, but much of considerable importance to the future will be gleaned from the exercise.
We now know the dates and identities of the last three Noahic Events. Represent the date of the last Galápagos Noahic Event as G1, the last Afar Noahic Event as A1, and the last Iceland Noahic Event as I1. Then:


From the theory presented above, it appears that these three Noahic Events have happened close together (i.e., in an interval of less than say 18,000 years) for the last five deglaciations, including the one currently in progress. Number these deglaciations 1 to 5 from present back into the past, as shown in Figure 16.
 |
Next, assume that these three Noahic Events all happened simultaneously for deglaciation 3. Then:

With these assumptions, we can specify the ordering of the dates of these individual Noahic Events for each deglaciation. It is:


Next, assume fixed individual periods, TG, TA, and TI for the triggering of these three Noahic Events. We can see immediately that TG will be the shortest period, and TI will be the longest period.
The above orderings say that we can get TG by measuring the elapsed time between the sudden rise in temperatures for deglaciations 1 and 2. Measuring along the -460 δD grid line in Figure 16 yields TG = 115,000 years. We can also get the period for TG from the graph by measuring the elapsed time between the sudden rise in temperatures for deglaciations 2 and 3. Measuring along the -460 δD grid line yields TG = 113,000 years. Noticing that time differences between the EPICA and Vostok chronologies are only a few percent immediately says that these two values for TG are indistinguishable. Take the average to arrive at a final estimate:

At this point we encounter a problem. The sudden rise in temperatures for deglaciations 3 and 4 yields an elapsed time between them, TI, of just 95,000 years. The time between deglaciations 4 and 5 is even shorter, giving a second value for TI of just 83,000 years. These two values for TI are significantly different from each other, and each of these values is significantly shorter than the value of TG just calculated, in violation of the fact that TG is known to be longer than TI.
This is evidence that the chronologies of these two temperature difference records are foreshortened. The fact that the two chronologies track fairly close to one another says that both chronologies are foreshortened—both chronologies are missing ice, and the missing ice is missing in the same places for both chronologies. This is not likely to be due to both research groups having failed to collect complete ice cores. Rather, it implies that ice has been lost from both ice cores at the same time in the past due to meltback. And this says something that is hardly surprising—that the Antarctic continental glacier has been subject to meltback by southern Noahic Events just as the northern glaciers have been subject to meltback by northern Noahic Events.
The modern altitude on top of the ice sheet at Vostok (3,488 meters) is greater than the altitude for EPICA. At this elevation, Vostok ice will be melted back only by Noahic Events from collision-induced hotspots which are closer to it than roughly 50 degrees. There are five of these in Hagstrum's list (Figure 17), so the probability
 |
of these Antarctic ice cores being free of meltback events seems to be zero. If all five of these hotspots are active, then five Noahic Event meltbacks are expected per glacial cycle in these ice cores. A substantial amount of time must be missing from these ice cores. Their present BP time scales cannot be accurate. They need to be redone before any reliable calculation of time-related quantities such as frequency of Noahic Events can be carried out using them.
It is clear, at this point, that these ice cores can no longer be used to support the Milankovitch-cycle theory of climate change. Whatever evidence of Milankovitch cycles their chronologies may have seemed to display is now seen to be merely coincidental.
Additionally, it now appears that the time calculated above for TG must be regarded as a minimum time. It is not clear what the real time may be.
Finally, the fact that these ice cores have suffered meltback events alters the interpretation of the finer structure in their temperature records. In general, as discussed above, meltbacks of northern glaciers will be recorded in Antarctic ice roughly 5,500 years after the meltbacks, appearing as rapid warming events (increasing δD) followed by a slow cooling. Meanwhile, any rapid warming due to meltbacks of southern glaciers will also be recorded, since the warming is expected to lag the meltback by thousands of years, just as in the north, but the meltback event itself will give rise to its own, prompt, pseudo-rapid-warming event. This results from the fact that air temperature increases with decreasing elevation. Thus meltback at the borehole location will increase the local temperature at that location purely due to decreased elevation of the glacier following meltback. This means that these temperature records mix together both true global-warming events with purely local warming-due-to-reduced-elevation events.
Local-warming meltback events can, in principle, be separated from global-warming events in these records by the fact that meltback produces a discontinuity in δD due to the new, warmer local temperature at the borehole following meltback. This produces an infinite slope—a sudden jump—in δD in the ice core. Unfortunately, as previously mentioned, sampling of the ice-core requires a finite thickness of ice, and this tends automatically to filter out higher frequencies. An infinite slope corresponds to the highest frequency, making local-warming events difficult to detect in real life. They will be clearly seen only if the sampling happens to cut the ice exactly where the infinite slope is located (i.e., on the boundary between the pre-meltback and post-meltback ice). Such instances will be rare, even if meltbacks are common, but an instance of one can be seen in the Vostok temperature record. It appears as a sudden jump up between the grid lines δD = -480 and -460, slightly to the left of the 100,000 BP tick mark (Figure 18). Not surprisingly, sampling did not happen to come out just right to detect this same infinite slope in the corresponding EPICA δD record.
 |
Because the time scale for these temperature difference records can no longer be relied on—because chunks of time are randomly missing from these records—it is not possible to use them to determine the frequency of Noahic Events in the past or to predict when the next one might be expected. Iceland, Afar, and Galápagos, having recently triggered, are believed to pose no threat for some tens of thousands of years minimum. But there are at least eight others whose timing is presently unknown. In principle, any one of these could trigger tomorrow—or even today.
It is abundantly clear that prevention of Noahic Events must immediately become humanity's highest scientific and technological priority. It appears that we must learn how to vent gases from our planet's core in a controlled fashion so that core collapse is never triggered. Our presently advanced civilization has no chance of surviving another Noahic Event. We must take action now, while we are still able to do so.
Once this has been accomplished, we must learn how to prevent advance of the glaciers in the absence of Noahic Events.
And once that has been accomplished, we must learn how to maintain Earth's protective magnetic field in the absence of Noahic Events.
And in the midst of all this, somewhere along the line, humanity will need to decide what average global temperature is optimum for Earth so that appropriate climate controls can be designed and implemented to maintain this chosen optimum.
Cool-headed thinking on this last question seems most likely to opt for a warmer rather than a cooler Earth. Fundamentally, we humans are all inextricably dependent upon agriculture for our survival. We have to eat to live. If history shows anything, it shows that we are all better off when there are lots of us. Famines, for example, which were all too frequent throughout recorded history, are rarely seen today, and when they are seen, they are almost invariably due to political failures, not uncontrollable forces of nature. Having lots of us means that the probability of someone finding a really good solution to the next pressing problem—such as those just posed above—is increased. And it means that the resources needed to implement the solution in the real world are more likely to be available. Thus it appears that Earth's mean temperature should be optimized for maximum global agricultural productivity. The last glacial maximum rendered most of Canada and Western Europe completely uninhabitable. Global cooling produces serious losses of potentially productive land surface area. Warming does the opposite.
The first eleven chapters of the biblical book of Genesis record a history and chronology of real-life people and events prior to 3,000 B.C. These chapters contain, by far, planet Earth's earliest written history.
I have found this history to be reliable, holding up under rigorous cross-examination via application of scientific principles and methods. I have repeatedly found that it provides quantitatively defensible answers to otherwise seemingly intractable modern scientific problems.
Genesis has provided the data needed to learn what modern human "aging" really is, and Genesis has provided the data needed to discover how to cure modern human aging. Genesis has provided the data needed to discover that Noahic Events exist. And now Genesis has provided the data needed to understand how Earth's climate really operates.
Anti-Bible prejudice has exacted a terrible toll on science and a terrible toll on society. Society at large and scientists in particular must move beyond this irrational prejudice. The survival of our present civilization now depends on doing so. ◇
I sent the first draft of this article out to several reviewers for their feedback, as is my custom. I was chided by two of them for failing to deal with God's promise to Noah and his sons that there would never be a repeat of a flood the likes of Noah's Flood. Hence this afterword.
It should be obvious from the main article that I believe that humans should now begin to take action to prevent Noahic Events from happening. The opposing view is that, after Noah's Flood, God promised (Genesis 9:8–17) that there would never again be a flood like Noah's Flood—a flood of such proportions as to snuff out the lives of nearly every human and air-breathing land animal on Earth—so there is no need for humans to worry about Noahic Events or take any action in regard to them.
To me, the opposing view seems mistaken at three levels.
First, there is the simple matter of correct interpretation of the ancient biblical text. There are multiple instances in Genesis where what seems to us today to mean "all inclusive" was clearly intended initially to mean instead "extraordinary largeness." I have previously discussed this in relation to the geographical extent of Noah's Flood,[17] so I will not dwell on it here. The specific case of Genesis 9:8–17 presently in question uses words like "never" and "every" and "all" and "everlasting" which all seem to say "all inclusive" to modern readers. The idea conveyed is that God's promise to Noah was for all future time—that there would never again, ever, be another Noahic Event. Let me be perfectly clear that this may be the originally intended meaning. The problem is that it may also not be the originally intended meaning. The possibility exists that the correct hermeneutic here, as with other instances in Genesis, is "extraordinary largeness" rather than "all inclusive." In that case, the meaning is not "this promise is forever" but rather "this promise is for a very, very long time."
I personally favor the "forever" interpretation of this passage, but, based upon my long study and research in Genesis, I find that the possibility that the "for a very, very long time" interpretation may be right cannot be excluded.
From there, for me, the path forward is very clear. It would be evil to wager the survival of civilization on my potentially incorrect preferred interpretation. Should the next Noahic Event happen tomorrow, I would at least like to know that I had done everything in my power—just as Noah did those many years ago—to mitigate its inevitable, unimaginable carnage.
Second, I feel the opposing view mistakenly disparages science. Recall that the Bible/science method, which has proven itself over and over again, begins with a high view of both the Bible and science, disparaging neither.
In the present case, the science side of things is perfectly clear. Unless humans intervene, another Noahic Event will happen. This is about as certain as a thing can be in science.
If we give this science its proper due, not disparaging it, then we are confronted with an apparent contradiction. The Bible seems most likely to be saying that another Noahic Event will never happen, while the science seems to be saying that, unless humans intervene, another Noahic Event will certainly happen.
To me, the path forward is once again clear. Long experience with Bible/science methodology teaches us to search for a synthesis of these two seemingly conflicting statements—a synthesis which disparages neither and allows both to be true. The synthesis, in this case, is easy. Both of these statements can be accepted as valid if, in fact, humans intervene to prevent future Noahic Events.
Third, I feel the opposing view fails to heed the dominion mandate:
And God created man in His own image, in the image of God He created him; male and female He created them. And God blessed them; and God said to them, "Be fruitful and multiply, and fill the earth, and subdue it;… (Genesis 1:27–28a)
The mandate to subdue the earth is pretty foundational. It appears to be the first words ever spoken to the first created humans. It is spoken as a command. It is not optional.
Humans have made a great deal of progress with this mandate. You may have noticed that we no longer find it necessary to shiver naked in the blowing snow on a cold wintry night. We have learned to subdue nature in this instance. We have invented these things called houses. We have equipped these houses with means of heating them and cooling them so we can work and play in comfort.
And now, at this time in our long history, we have come to understand a phenomenon of nature—Noahic Events—which is much more in need of subduing even than cold wintry nights.
As I understand all this, God is now saying, "I made a covenant with Earth's inhabitants, both humans and animals, five and a half thousand years ago, which I intend to keep. I have put you humans in charge of the Earth and its living creatures. There's a job which now needs doing. It's time for Earth's Noahic Events to be subdued. Now get to work and make it happen."
This may leave some wondering what role they are supposed to fill in the subduing of Noahic Events.
Think of World War II. It was a rallying of the free peoples of the world to stop the aggression of tyrants. What were most people busy doing? They were busy supporting the war effort however they could. For most citizens, this meant simply doing their usual jobs and paying their taxes. They supported the war effort because they understood that to lose was to condemn themselves, their children, and their grandchildren to slavery and tyranny.
Support the effort to end the tyranny of Noahic Events just as you would have supported the fight for freedom in World War II. A simple first step is to distribute this article far and wide deliberately to counteract present indoctrination with the wrong, CO2-emissions theory of global warming.
The Biblical Chronologist is written and edited by Gerald E. Aardsma, a Ph.D. scientist (nuclear physics) with special background in radioisotopic dating methods such as radiocarbon. The Biblical Chronologist has a fourfold purpose:
The Biblical Chronologist (ISSN 1081-762X) is published by: Aardsma Research & Publishing Copyright © 2024 by Aardsma Research & Publishing. Scripture quotations taken from the (NASB®) New American Standard Bible®, Copyright© 1960, 1971, 1977, 1995 by The Lockman Foundation. Used by permission. All rights reserved. www.Lockman.org } |
^ en.wikipedia.org/wiki/Paris_Agreement
(accessed March 7, 2024).
^ Gerald E. Aardsma, A New Approach to the Chronology of Biblical History from Abraham to Samuel, 2nd ed. (Loda, IL: Aardsma Research and Publishing, 1995). www.BiblicalChronologist.org.
^ For readers unfamiliar with the term "virtual history," imagine that the universe was created (i.e., brought into existence out of nothing) by God at midnight last night. Then real history begins at midnight last night, and virtual history is everything before midnight last night, back to and including the Big Bang. Modern biblical chronology dates the creation of the universe to 5176±26 B.C., not midnight last night, so virtual history, as used here, is everything prior to 5176±26 B.C.
^ See, for example, Gerald E. Aardsma, "The Route of the Exodus, Part X: The Location of the 'Red Sea' Encampment (and the Meaning of Yam Suph)," The Biblical Chronologist 14.3 (February 6, 2024): 1–4. www.BiblicalChronologist.org.
^ www.e-education.psu.edu/earth104/node/822
(accessed February 20, 2024).
^ See, for example, www.atmo.arizona.edu/students/ courselinks/spring17/atmo336s2/lectures/sec5/gwdiscussio
n.html (accessed February 28, 2024).
^ www.e-education.psu.edu/earth104/node/1278
(accessed February 20, 2024).
^ www.e-education.psu.edu/earth104/node/1258
(accessed February 20, 2024).
^ www.e-education.psu.edu/earth104/node/1258
(accessed February 20, 2024).
^ www.e-education.psu.edu/earth104/node/1278
(accessed February 20, 2024).
^ Gerald E. Aardsma, Noah's Flood Happened 3520 B.C. (Loda, IL: Aardsma Research and Publishing, 2015), Chapter 43, 307–313. www.BiblicalChronologist.org.
^ Gerald E. Aardsma, "The Cause of Noah's Flood," The Biblical Chronologist 3.5 (September/October 1997): 1–14. www.BiblicalChronologist.org.
^ See, for example, Gerald E. Aardsma, "Inner Core Instability and the Origin of Plate Tectonics, Antipodal Hotspots, Earth's Magnetic Field, and the Moon," The Biblical Chronologist 10.13 (July 16, 2020): 1–8. www.BiblicalChronologist.org.
^ Gerald E. Aardsma, Noah's Flood Happened 3520 B.C. (Loda, IL: Aardsma Research and Publishing, 2015), 307–313. www.BiblicalChronologist.org.
^ Jonathan T. Hagstrum, "Antipodal hotspots and bipolar catastrophes: Were oceanic large-body impacts the cause?" Earth and Planetary Science Letters 236 (2005): 13–27.
^ Human life spans declined from 925 years on average to modern levels near 75 years over the course of roughly a thousand years following Noah's Flood. They did this because Noah's Flood exposed the seafloor around Antarctica. What we modern humans call "aging" is merely a disease caused by deficiencies of two previously unknown vitamins naturally produced in the atmosphere from methylphosphine gas (MeP). The two vitamins are methylphosphonic acid (MePa) and methylphosphinic acid (MePiA). The source of MeP was natural breakdown of organic, phosphorous-rich ocean sediments surrounding Antarctica. By exposing these sediments to low pressures, they were emptied of MeP. As a result, there is essentially no MeP available today, so MePA and MePiA are no longer being produced in the atmosphere today, and people are growing sick due to MePA and MePiA deficiency diseases (also known as "aging") and dying at tragically young ages, way before their life span potential of 925 years is reached. My book, Aging: Cause and Cure, 3rd ed., explaining all of this in detail is freely available from my website, www.BiblicalChronologist.org. The recently discovered, anti-aging vitamins are also available there.
^ Gerald E. Aardsma, Noah's Flood Happened 3520 B.C. (Loda, IL: Aardsma Research and Publishing, 2015), 201–204. www.BiblicalChronologist.org.