
| |
| Volume 2, Number 6 | November/December 1996 |
Was Noah's Flood global or local?
Two issues ago I introduced some remarkable sedimentary data from Elk Lake in Minnesota and applied it to a different question. I asked, "Was Noah's Flood a global cataclysm?" By "cataclysm" is meant an overwhelming geological upheaval in which the entire surface of the earth is torn apart in great tectonic convulsions. I showed that the Elk Lake data combine with Biblical chronology data to answer this question with a definitive no.[1]
This issue it is not the geological potency of the Flood (i.e., was the Flood cataclysmic or tranquil) which is in question. Rather, it is the geographical extent of the Flood (i.e., was the Flood global or local) I wish to probe. This latter question was, in fact, the entire reason I began to study the Elk Lake data. My motivation for launching into a study of these data was to investigate the question of the geographical extent of the Flood as forcefully and directly as possible using the data and methods provided by modern science.
Falsification of the cataclysmic Flood model falls out of the Elk Lake data with very little effort whether one is looking for it or not. Not so the question of geographical extent. I have had to labor over this one.
But Elk Lake has certainly rewarded my investment of time and mental energy. Its sedimentary data preserve a record of the past which speaks with considerable clarity to this long-debated question—once the technical chronological work has been done and the mass of available data from the lake has been digested, that is. I trust you will find the result—another new discovery of far-reaching consequence—as exhilarating and edifying as I did when, after hours of effort, and no little consternation and confusion, light suddenly dawned.
Some conservative Christian scholars have argued from the Biblical text that the Flood must have been world-wide,[2] while others have argued, also from the Biblical text, that a world-wide Flood is not demanded or intended.[3]
For example, many have noted that the text says "the mountains were covered"[4] and have gone on to conclude that this necessitates a world-wide Flood, since water seeks its own level. This seems a sound inference, and a cogent argument for a global Flood. Other weighty arguments from the text of Scripture can be added to it, as Whitcomb and Morris have capably shown in The Genesis Flood.[5]
But then, to an unbiased reader, the text does not appear entirely one way on this question. For example, the text says, "and God caused a wind to pass over the earth, and the water subsided".[6] This wind is the only mechanism for drying up the Flood which is explicitly mentioned in the historical narrative of the Flood which we are given in Genesis. (The next verse specifies that the "fountains of the deep and the floodgates of the sky were closed", but these actions merely shut off the source of the water, they play no role in actively drying up the Flood waters which had already accumulated.)
This reference to the wind comes right at the turning point in the narrative. Previous to the wind the Flood "prevailed"; after the wind is mentioned, the Flood "subsided" and "decreased". Consequently, the text does not seem to be saying the role of the wind was merely to dry up the soggy earth after all the water had finally receded in some unspecified fashion. Rather, the text seems to be saying that the wind was itself responsible for causing the waters of the Flood to decrease.
But this is difficult to understand in a global Flood context. How could wind, apart from some supernatural mechanism (which the text gives no hint of at this point), cause the waters of a world-wide Flood to subside? Wind can evaporate water, but the atmosphere can only hold a small amount of water in vapor form relative to the indicated depth of the Flood. For evaporation to cause the waters of the Flood to subside, there would need to be some place for the evaporated water to be precipitated to, and this demands a Flood which is not world-wide. Wind can also drive water from one area to another through surface friction and wave action, but here again there must be some available basin to receive the driven waters if wind is to cause a flood to subside, as the text seems clearly to say was the case with Noah's Flood. So there is this difficulty; if the Flood was world-wide, then how could a wind cause the waters of the Flood to recede?
Let me be perfectly clear that I am not arguing we should adopt a local Flood model. Rather, what I am driving at is that the interpretation of this portion of the Biblical text in regard to the geographical extent of the Flood is not a trivial exercise with an obvious conclusion—there have been dedicated men of God on both sides of the question. My point is simply that the final resolution of this matter seems unlikely as long as the evidence is restricted to the Biblical text alone. In addition to the written Word, it seems at least reasonable and appropriate, if not, indeed, essential, to hear whatever testimony can be elucidated from the book of nature.
I have already shown that the Flood appears to have been active over a very large geographical area in the Old World, so that we seem clearly to be dealing with a phenomenon which has no right to be called local.[7] But the regions where archaeology and the Biblical text seem at present to combine to indicate the Flood was active—namely, Egypt, Palestine, Mesopotamia, and Ararat—occupy a fairly small area relative to the entire surface of the globe, so that the conclusion that the Flood was global does not seem justified on the basis of these data either.
It seemed to me that perhaps the fastest way to settle this particular issue would be to examine some New World geophysical reservoir for evidence of the Flood. Hence I began to study the Elk Lake sedimentary data some seven months ago.
What should the Flood be expected to look like in the Elk Lake data? An unusually thick annual layer of sediment is perhaps the most obvious expectation, but this question could not be answered with any degree of certainty when I began this study. The difficulty was that I had no fixed scientific model of the Flood available which I could rely on. Only the chronology was known. All I could say with confidence was that if the Flood was felt at Elk Lake then the Elk Lake data should show some kind of anomalous behavior within dating uncertainties of 3520±21 B.C.[8]
Do the Elk Lake data show any anomalous behavior at this date? Yes, most certainly they do, though the process one must go through to arrive at this conclusion is not a trivial one, and the implication of the result, when once it has been obtained, is not immediately obvious either.
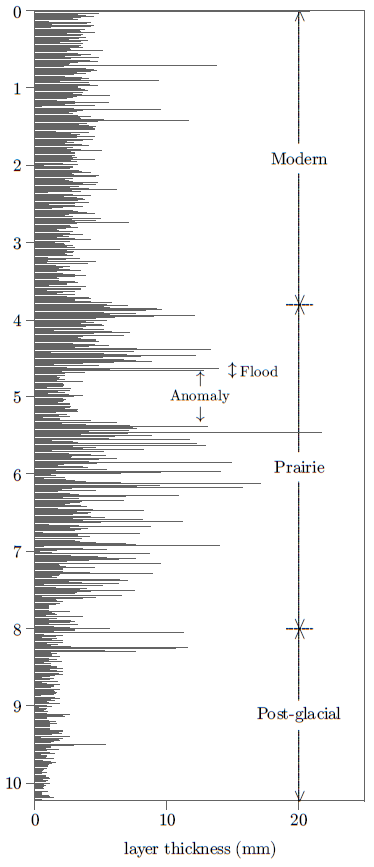 |
Figure 1 shows the measured thickness of the annual sedimentary layers at Elk Lake over the entire 10,000+ years of the record. Those who have studied the wealth of data preserved in the sediments of Elk Lake most closely divide the history of the lake into the three stages shown in Figure 1. Roger Y. Anderson of the department of Earth and Planetary Sciences of the University of New Mexico summarizes these three stages as follows:[9]
About 14 ka [i.e., 14,000 years ago], withdrawal of the [glacial] ice sheet stranded [and buried] a large block of ice that had melted by about 3000 yr later. The ice block formed a deep lake basin in a terrain of unweathered till, clothed by coniferous forest [as revealed by pollen from the sedimentary layers produced in the lake at that time]. This early [post-glacial] lake and its environs was dominated by cold, anticyclonic [i.e., high pressure system] winds from the [glacial] ice margin to the northeast…About 8.0 ka, after further decay of the ice sheet, cold anticyclonic winds were replaced by incursions of relatively dry Pacific air that reached progressively farther into the continental interior. In response to these incursions, the prairie shifted northeastward and there ensued a 4000 yr period of drought in north-central Minnesota [where Elk Lake is located]. The more saline mid-Holocene [prairie] lake was surrounded by scattered stands of oak, sparse grass, Artemisia [i.e., sagebrush], and some open, bare ground. The varves [i.e., annual layers of sediment] that accumulated in Elk Lake more than doubled in thickness as a result of the influx of eolian [i.e., wind borne] clay and silt. The loess [i.e., wind produced deposit] was suspended from the region to the west and was carried to Elk Lake by dry westerly winds…
Within a few centuries, at about 3.8 ka, the tropical airstream [from the Gulf of Mexico] moved northward, bringing additional moisture, and a new balance was struck between Arctic, Pacific, and Tropical airstreams. The new expression of moisture and seasonality brought pine, hardwoods, and forest soils to the Elk Lake drainage.
This brief history reveals a long-term progressive change in the climate of Elk Lake from the end of the glaciation which created the lake to the present time. This long-term change seems adequately explained by two factors: the retreat of the ice sheet, and changes in insolation (i.e., total radiation received from the sun) due to slow, long-term changes in Earth's tilt and orbital parameters. Computer simulations which take these parameters into consideration support this conclusion as the following observations from one such simulation show:[10]
When the ice sheet was large, generally cool conditions should have prevailed, consistent with the generally cool conditions inferred from the pollen data from Elk Lake for the interval 11,600–6000 varve yr. With the replacement of the glacial anticyclonic wind regime by stronger westerlies during the interval between 9000 and 6000 varve yr, precipitation should have decreased to its lowest levels during the Holocene, again consistent with the Elk Lake evidence. Finally, during the past 6000 yr, modern conditions should have developed as the seasonal distribution of insolation gradually approached present-day levels.
Most of the details of the sedimentary record are also readily explained within this overall climatic framework. For example, the annual layers are observed to be highly variable and often thick during the prairie period (Figure 1). The pollen data (e.g., of sagebrush) clearly indicate that this was a dry period at Elk Lake. Several factors can be identified which conspire to produce thick and variable annual layers when the climate is dry. First, the lake becomes surrounded by sparsely vegetated, open prairie. Much soil is exposed to the elements. The ground is easily dried by the sun, and prevailing winds, not blocked near the ground by forest, are able to pick up clay and silt from the ground and deposit them in the lake. This wind blown detritus adds directly to the annual layer thickness of lake sediments, of course, but it also adds indirectly to the layer thickness by fertilizing the lake and increasing its own biologically produced sediment load. In addition to these factors, the level of the lake reduces when the climate is dry. This enhances the ability of waves, produced by winds (again not blocked by forest) to resuspend sediment from the shallow margins of the lake and redeposit it in the deep center of the lake (from which the sediment cores were taken).
Conditions are more moist today than they were back in the prairie period. As a result, the lake is surrounded by forest, which limits production of wind-borne detritus and inhibits formation of thick annual layers. Thus the fact that annual layers are relatively thin and stable for the modern lake stage is also easily understood, and the transition from thick, variable layers to thin, stable layers which begins shortly after layer 4000 and takes several centuries to complete, is also easily explained.
What is not explained—what is anomalous—is the sudden transition into a thin, stable layer production mode at about layer 5300, and the equally sudden transition back out again at about layer 4700 (Figure 1). What combination of geophysical and climatic factors could have produced these unexpected 600 layers? This question surfaces repeatedly within the 336 page Geological Society of America report on the lake, but no truly satisfactory answer is ever found.[11]
The difficulty is that the data from the cores during this 600 layer interval do not seem to paint a coherent picture. For example, the average thickness of the sediment layers during this interval and their low variability are characteristics which are most closely matched by the annual layers of the modern lake stage. This implies a climate more similar to that of today than to that of the prairie stage in which these 600 layers are imbedded. But the pollen data show that there was no change in the vegetation surrounding the lake during the interval in which these layers were deposited—as far as the vegetation was concerned the lake's environment was still prairie for the entire time:
At Elk Lake the prairie period has been divided into three climate phases on the basis of diatom, sedimentologic, and geochemical data: an early xeric [i.e., low moisture] phase between 8500 and 4500 varve yr, a somewhat wetter phase from 5400 to 4800 varve yr, and a dry phase between 4800 and 4000 varve yr. The pollen record does not show this subdivision clearly…[12]
At this time the lake entered a brief phase (ca. 600 yr) that appears to have been a precursor to lake conditions characteristic of the latest stage in Elk Lake's development beginning at 3.8 ka, but differs from the more permanent change because it was not accompanied by the same changes in vegetation.[13]To further add to the complexity of the situation, cysts from chrysophycean algae show a return to conditions which existed in the post-glacial lake during this interval:[14]
Our cyst-assemblage data indicate that limnological [i.e., lake] conditions during the mid-Holocene prairie period shifted for a period of about 500 yr between 5.3 and 4.8 ky. Dominant cysts indicate a striking return to early postglacial conditions…How is it possible for a single lake to go on showing characteristics of three very different stages all at the same time for 600 years? This period is truly anomalous, and it is the only real anomaly in the entire dataset.
Might this anomaly have something to do with the Flood?
Getting the answer to this question obviously has everything to do with chronology. A causal relationship can only be postulated if there exists a temporal coincidence between the two events. The single most important question, therefore, is: "Does the Flood coincide with the Elk Lake anomaly?"
I have indicated the range of layers over which a detailed computation suggests the Flood should be seen at Elk Lake by back-to-back arrows in Figure 1. (The technical details of this computation are included in a separate appendix to this article below.) Clearly there is some overlap with the anomalous interval. It is appropriate, therefore, to seek a causal relationship between the two.
Curiously, however, the Flood seems coincident with the transition out of the anomalous period. One naturally expects the Flood to cause anomalies, not to cure them (other than the "anomaly" of the wickedness of mankind in Noah's generation, that is). Furthermore, the transition out of this anomalous interval seems to mark a transition from wetter to drier conditions, based on the nature of the individual layers, and this is also in the opposite direction of what one would expect from a global Flood.
The immediate impression is that the anomaly at Elk Lake has nothing to do with the Flood and that the Flood is simply not present at Elk Lake (and, hence, not a global event).
But this immediate impression is altogether wrong. A totally different conclusion presents itself when closer attention is given to the anomalous 600 layers themselves.
I pointed out above that the data from the Elk Lake cores during this 600 layer interval do not seem to paint a coherent picture. I asked how it would be possible for a single lake to go on showing characteristics of three very different stages all at the same time for 600 years.
The answer to this perplexing question is really very simple, if somewhat perplexing itself—it isn't possible. No natural process—not even a global Flood—can bring about 600 years of the sort of self-contradictory conditions the Elk Lake data appear to testify to during this anomalous interval.
The best brief summary of the amassed data from Elk Lake that I can give of these 600 layers is that they seem to call for a sudden transition, within a decade or two, from dry wind-swept prairie to moist, still, semi-desert. This moist semi-desert episode apparently persisted with hardly a breeze and never a thunderstorm for 600 years before suddenly reverting back to dry wind-swept prairie.
But this is an impossible picture. Increasing moisture does not convert prairie to semi-desert; it converts prairie to forest. And how can the wind be turned off for 600 years in any region or climate? And how does one increase moisture while decreasing storminess? This picture just doesn't make sense—I judge it impossible. The created world simply doesn't behave in so unrational and inexplicable a manner.
Now please don't jump to the conclusion that I am saying that something supernatural happened at Elk Lake for 600 years, for I am most certainly not saying any such thing. I am not saying the mix of data which is found at Elk Lake during this anomalous interval is inherently impossible. And I certainly don't mean to question the reality of the 600 layers which the researchers identified in the core. Impossibility only enters in when one tries to interpret these 600 layers in terms of 600 years—they seem to paint an entirely coherent picture when interpreted as a unit of sediment which was deposited in a single year.
I suggest that the assumption that the 600 layers which comprise this interval are annual is incorrect. I propose that rather than recording 600 years during which 1 to 2 millimeters of sediment were deposited each year, this anomalous section of core should be interpreted as recording a single year during which nearly a meter of sediment was deposited on the bottom of Elk Lake.
The evidence that these 600 layers do not correspond to 600 years is significant. For example, radiocarbon measurements show 920±210 (1σ) fewer calendar years spanning this anomalous section of the core than the direct count of layers indicates.[15]
Also, if these 600 layers were deposited over the course of 600 years then they would be expected to show a normal pollen accumulation rate, but if they were all laid down in a single year then pollen accumulation rates calculated on the assumption of 600 years might be expected to come out rather low (provided these layers were not all composed of reworked older sediments containing normal pollen concentrations). In point of fact, "the pollen-accumulation rates are lowest for the period from 5400 to 4800 varve yr".[16] That is, the pollen accumulation rates were lowest exactly in this anomalous 600 layer interval. It appears that pollen accumulation rates which averaged[17] around 20,000 grains/cm2/yr and fluctuated up to 48,050 grains/cm2/yr for the prairie period dropped to just 1,870 grains/cm2/yr during this 600 "year" interval.[18]
This observation is difficult to explain if these 600 layers are truly annual. Whitlock et al. have suggested that this "may represent a time when slopes were less vegetated than before or after".[19] But why would slopes be less vegetated during this period which is uniformly regarded as more moist than the rest of the prairie period? And if the slopes were less vegetated, and therefore the ground more exposed, how would it be possible to have 600 years without even a single thick varve from sheet erosion during this more moist interval?
If these 600 layers are annual, and represent a change to more moist conditions, some significant change in vegetation, especially toward a higher percentage of trees, would be expected during these 600 years. If they were all laid down in a single year, no change would be expected.
The fact that no significant change in the vegetation is seen in the pollen record has already been shown above. How is it possible to increase the moisture in a region for 600 years and produce no significant change in its vegetation? Notice that a very significant change in vegetation did accompany the onset of more moist conditions at the transition from prairie to modern lake stages. As Anderson observed above for the prairie to modern transition, "The new expression of moisture and seasonality brought pine, hardwoods, and forest soils to the Elk Lake drainage."[20]
The transitions from post-glacial to prairie, and prairie to modern lake stages are all visibly gradual (Figure 1). If these anomalous 600 layers represent 600 years of climate change, one would naturally expect the transition into and out of this interval to also be gradual. But if these layers represent a single year's deposition, gradual transitions at the boundaries are not expected. Figure 1 clearly shows that the 600 layer interval in question begins and ends abruptly.
What natural climatic factors could account for such abrupt transitions at both ends of a 600 year climate fluctuation? According to Bradbury et al., the "concomitant reduction of clastic indicators suggests that climate during this time was unusually calm".[21] There would be no dust blown into the lake if there were no wind, of course. But how does one go about shutting off the wind over relatively open prairie for 600 years? And why would the wind shut off so suddenly and completely, remain off so long, and resume so suddenly again? The computer climate simulations of the Elk Lake region presented by Bartlein and Whitlock[22] give no hint of such an unusually calm interval.
Bradbury et al. go on to suggest "the rapid response is consistent with the triggering of dust suspension at a shear threshold that is determined by soil moisture."[23] According to this explanation the ground moisture rose sufficiently to inhibit dust production for 600 years. But we know what actually happens when moisture increases—one gets a gradual transition from prairie to modern lake stages lasting several centuries, as is clearly shown by the actual data of Figure 1, not an abrupt transition at a shear threshold.
The conclusion that these 600 layers do not represent 600 years seems unavoidable. The original researchers' failure to come to this conclusion is understandable, however. A one meter thick laminated annual layer must have seemed a total impossibility to them—they would no doubt have dismissed the idea, if it occurred to them, with the single question, "But what could ever have produced such a monstrously thick annual layer?"
Yes, what indeed.
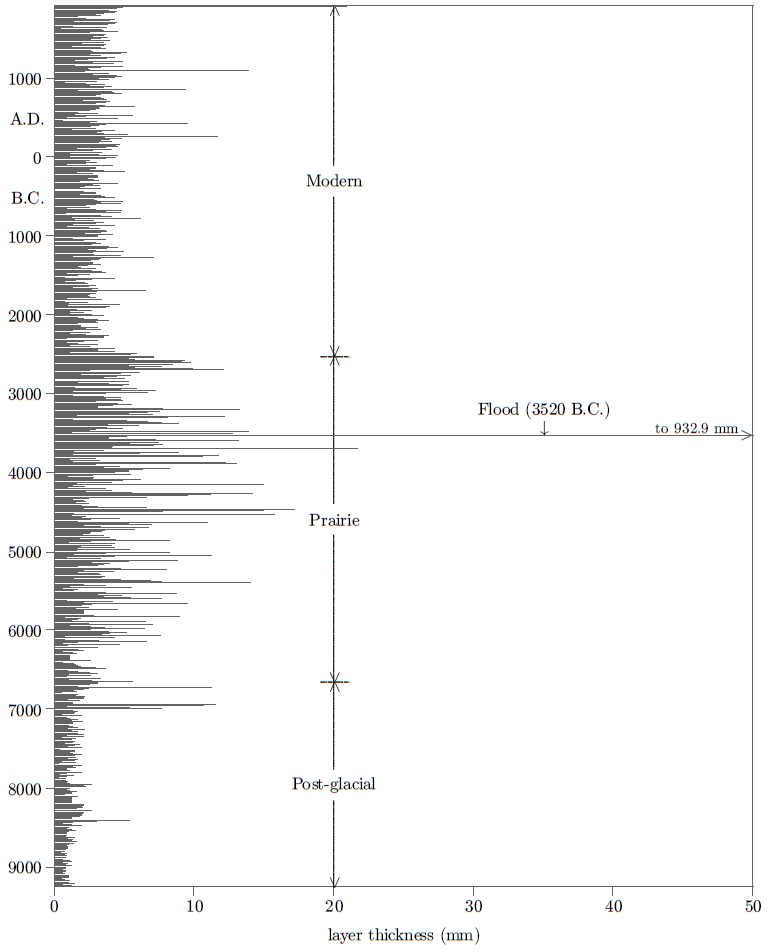 |
If we interpret these 600 layers as the stratified deposit of a single year and make a roughly 17% correction to the layer count as discussed in the Appendix then the chronology of the Elk Lake core data shown in Figure 2 results. Given this view of these data it is nearly impossible to avoid the conclusion that Noah's Flood was felt at Elk Lake. A 932.9 millimeter thick annual layer, in the midst of 10,000 annual layers just 2 millimeters thick on average is pretty clear evidence of something remarkably unusual. It is obviously not difficult to imagine how a massive Flood of extended duration could produce just such a layer. When we add to this the fact that this layer occurs at precisely the right date for Noah's Flood, the conclusion that it was, in fact, produced by Noah's Flood seems almost inescapable.
I say "almost" only because God's great creation is full of surprises—experience teaches the scientist a prudent caution. So to make what I am suggesting as precise and clear as possible while at the same time eschewing dogmatism, it seems best to frame this in the form of another in our series of Flood hypotheses.
Flood Hypothesis 5 The section of the Elk Lake core depicted in Figure 1 as lying roughly between layers 5300 and 4700 was deposited in a single year as a result of Noah's Flood.
If this claim is valid (and I will be very surprised if it does not turn out to be valid when all is finally said and done) then the further conclusion that Noah's Flood must have been a global event seems inevitable.
But, interestingly, it was not a cataclysmic event. It did not cause the entire geologic column or even any significant portion of it. It was not the cause of all the fossils the geologic column contains. And it was not the cause of the ice age. All of these relationships are shown to be impossible by the stratigraphy and chronology of Elk Lake.
The picture of the Flood which emerges from the Elk Lake data is that it was similar to what one would naturally expect of a very large, very deep body of water today. Perhaps the best modern analog is provided by the Pacific Ocean. It covers a vast amount of land to great depth, but the land it covers is not being catastrophically ripped up and demolished by the presence of its mighty waters. In fact, for the most part the ocean bottom just goes on collecting a thin layer of sediment each year. It seems probable that if a deep depression such as Elk Lake were to be located on the bottom of the Pacific Ocean, it would act as a very efficient trap for debris settling out of the overlying water column. Such a model seems most appropriate for explaining the actual data at Elk Lake at the present time.
It is difficult to find a term to describe this model of the Flood. The term "tranquil" has a long history in regard to the Flood. It appears to have been used initially to simply mean non-cataclysmic, and such a connotation is certainly appropriate in the present case. But I am loathe to use this label because some have used it to mean a Flood which did no geological work whatsoever, and which left no geological trace of its presence. This extreme is physically absurd and blatantly contradicted by the Elk Lake evidence.
Since the best modern analog to the model which is emerging from the combined Elk Lake geophysical data and Near East archaeological data seems to be the ocean, perhaps "global pelagic Flood" would serve, "pelagic" meaning "like the open sea". (I am open to other suggestions.)
In any event, these anomalous 600 layers at Elk Lake—this 932.9 millimeter thick annual layer—is the first piece of geologic data to ever be chronologically synchronized with the Genesis Flood. Many other geologic events have been ascribed to Noah's Flood over the past few centuries, but this has invariably been done in either complete ignorance or complete defiance of chronological constraints. Since one cannot hope to get history right apart from sound chronology, one cannot hope for much of true value or significance from such claims, and, indeed, most have simply fallen by the wayside over the years. Because of its firm chronological moorings, the Elk Lake anomaly is unique among such claims.
As I see it, the Elk Lake anomaly is the only legitimate geological link to the Flood which is known at present. I suggest that it embodies, in an embryonic but nonetheless real state, the long-sought intersection of Genesis and geology. If my experience of the past several years of working with the new Biblical chronology in relation to the Exodus and Conquest is any guide, then this newly discovered intersection will not remain in an embryonic state for long. ◇
(The "Readers Write" column follows this appendix.)
Where in the sedimentary record of Elk Lake would the Flood be expected to be seen? More specifically, how many layers should one count back in the core samples which were taken from the lake bottom to get to the time of the Flood?
Biblical chronology places the date of the Flood at 3520±21 B.C.[24] The topmost annual sedimentary layer which has been preserved in core samples from Elk Lake (i.e., annual layer 1) corresponds to A.D. 1927.[25] Thus, if there were no counting error or dating uncertainty of any sort, 3520 B.C. would correspond to the (1927+3520=) 5,447th annual sedimentary layer from the top (i.e., layer 5,447). In fact, however, there are counting and dating uncertainties which prohibit the identification of the year of the Flood with any single sedimentary layer. These uncertainties allow the Flood to be located anywhere within a specified range of layers.
There is, first of all, an uncertainty in the Biblical date of the Flood of ±21 years (3σ). This is quite tiny, however, relative to the experimental counting uncertainty of annual layers at Elk Lake. This uncertainty is due mainly to technical aspects of preservation and recovery of the annual sedimentary layers during coring and processing by the science laboratory. Donald R. Sprowl has measured this uncertainty by comparison of annual layer counts in independent cores covering the same time interval. He has found that it amounts to about ±500 layers (2σ) at the 5,447th annual layer.[26] Therefore, if this is the most significant source of error, we should expect the year of the Flood to fall with near certainty within ±750 layers (i.e., 3σ) of layer 5,447 (i.e., somewhere between layer 4,700 and layer 6,200).
However, there is another potential source of error which significantly affects our effort to compare the Biblical chronology date of the Flood with the secular chronology at Elk Lake. Sprowl explains:[27]
The above analysis assumes that the counting errors are normally distributed with zero mean, but this is only true if the probability of counting too many varves [i.e., annual sedimentary layers] is the same as that of counting too few. Too many varves can be counted when subannual sets of laminations appear to be annual. However, varves can be obscured or left undistinguished sedimentologically or by the cleaning or polishing technique used. It is my (subjective) judgment that counting too few varves is more likely than counting too many, and I expect the errors to be biased on the low side. … Because of this expected negative bias in the varve counting process, the highest count from a given interval was used as the estimator of the actual number of varves present. Presumably, this still underestimates the actual number of varves present.
We must also take this potential loss of annual layers into consideration if we wish our comparison of Biblical and Elk Lake chronologies to be meaningful. Notice that if ten percent of the layers have been missed (which doesn't seem at all impossible judged on the basis of the measured counting precision) the layer number will be 550 years short of true calendar years by the time of the Flood (which was roughly 5500 years ago). This is a substantial offset, which cannot be ignored.
This problem cannot be solved by counting annual layers in duplicate cores because the same problem of unidentified (missing) annual layers will pertain to both. What is needed, in fact, is some sort of independent chronometer which can be applied to the Elk Lake data to help determine just how many annual layers may have been missed in the counting process. Fortunately, radiocarbon supplies what is needed in this instance.
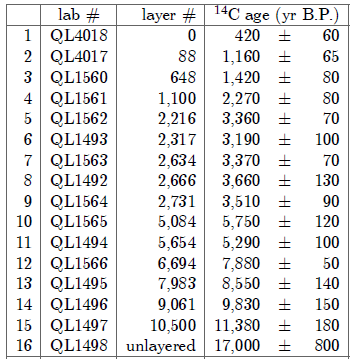
Anderson et al. report sixteen radiocarbon measurements on organic carbon from the Elk Lake cores (Table 1).[28] We would like to use these measurements to estimate how many annual layers may have been left uncounted in the Elk Lake sediment cores back to the time of the Flood.
 |
To use these samples correctly for our purpose requires some knowledge of how radiocarbon dating works—the problem is actually not a trivial one. I will skip over the basics of the global production of radiocarbon and its subsequent distribution in various geophysical reservoirs for the sake of brevity and merely state that the most important point to be aware of in the present context is that radiocarbon dates will appear too old if carbon atoms which have not been derived from carbon dioxide in the atmosphere are taken up by the samples being dated. The taking up of such carbon is a common phenomenon in lakes because they commonly receive carbon atoms (as carbonates) from leaching of carbonate rocks and soil by rainwater runoff. Such carbon is referred to as old carbon, to distinguish it from carbon atoms derived from the atmosphere. The presence of old carbon in a sample gives it an old radiocarbon age even while it is still living. Fortunately, the problem can be corrected in many instances.
Elk Lake, which is located in calcareous glacial drift, is not exempt from the old carbon phenomenon. The trees which live around the lake do not contain old carbon because they derive all of their carbon atoms exclusively from the atmosphere. But anything which lives within the lake, such as fish or clams or diatoms, will contain old carbon. The radiocarbon dates on organic material from the Elk Lake cores will include an old carbon component, because the organic material comes from organisms which once lived in the lake.
The presence of old carbon in Elk Lake significantly complicates the task of determining what fraction of annual layers have gone uncounted on average, but, fortunately, it does not render it impossible. The old carbon phenomenon would only be fatal to our task if the concentration of old carbon in the lake changed with time (for then it would be impossible to tell whether the change in measured radiocarbon concentration in the samples was due to the decay of radiocarbon atoms with time or to different concentrations of old carbon in the lake when the various samples were deposited).
It is very likely that the concentration of old carbon did change in the lake early in its history, because freshly deposited calcareous glacial till is likely to weather more rapidly at first. It is also probable that the concentration of old carbon in the lake would change when the vegetative cover surrounding the lake changed, because of the different rate of weathering of calcareous till likely to accompany such a shift. Thus, to keep the old carbon phenomenon from invalidating our radiocarbon estimate of missing layers, it is necessary to restrict the analysis to approximately the upper 3000 layers, where significant long-term changes in old carbon concentration in the lake would be unlikely.
Nine of the sixteen radiocarbon samples published by Anderson et al. (Table 1) fall within this range. We wish to separate the constant old carbon contribution from the radiocarbon ages of these samples so we can use them to accurately measure real calendar years. There are two equations involved in this problem. First is the relationship between the radiocarbon age of a sample which lived in the lake, ALAKE(t), and that of a tree living at the same time beside the lake, AATM(t). This relationship is expressed by the equation:
AATM(t) = ALAKE(t) - AOLD (1)
In this equation, AOLD is the old carbon contribution to the radiocarbon age of a sample which grew in the lake. It appears without functional time dependence, (t), in the equation because it is assumed constant over the time interval to which we will be applying the equation, as just discussed.
The second equation provides an explicit relationship between the time variable, t, and the layer number, L.
t = - ( (1 + f) L + 23) (2)
The 23 in this equation arises as follows. Since we are dealing with radiocarbon it is most convenient to adopt the standard radiocarbon convention that t=0 corresponds to A.D. 1950. (Thus, A.D. 1940 corresponds to t=-10, and so forth.) Now L=0 corresponds to A.D. 1927, as mentioned above, which corresponds to t=-23.
The f in the equation represents the fraction of annual layers which have been missed in the counting process. It is the unknown we wish to solve for.
It is impossible to solve these two equations in closed form because the time dependence of radiocarbon age for samples which grew in the atmosphere (e.g., trees) does not correspond to any simple mathematical function. It is necessary to employ other means.
I adopted the following approach. First I chose a value for f and used it to calculate t for each of the nine radiocarbon samples. I then looked up AATM(t) in the 1993 Radiocarbon calibration issue.[29] Next I plotted AATM(t) versus the measured ALAKE(t) given in Table 1 in the "14C age (yr B.P.)" column. According to equation 1 this should yield a straight line with a slope of one for the correct choice of f. I used a standard, unweighted linear regression to compute the slope and intercept for various choices of f.
Figure 3 shows the resulting graph of slope versus f. A linear regression applied to these data yields a straight line which intersects y=1 at f=0.1696. This says that on average 17% of annual layers were missed in the Elk Lake cores. When this value of f is substituted back into equation 2 with t = -(3520+1950) = -5470 (i.e., the date of the Flood) the calculated layer number, corresponding to the Flood, is 4,649.
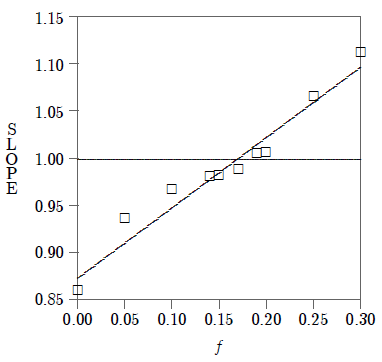 |
Estimating the uncertainty in f determined in this manner is a little difficult. It is necessary to do so, however, to get some impression of the imprecision in the Flood layer number computed by this method. I have fit two other straight lines to selected data in Figure 3 for this purpose. First, I have tried to estimate the smallest value f might reasonably be assigned by fitting just the data points f=0.05, 0.1, 0.25, and 0.3. This yielded f=0.1477 with the corresponding Flood layer at 4,737. Second, to estimate the largest value of f, I fit just the points f=0.17, 0.19, and 0.2. This gave f=0.1888 and the Flood layer at 4,574.
These results seem adequately summarized by the single statement that the Flood is expected to be seen, if present in the Elk Lake data, at layer number 4,650±100 (3σ). This is the range shown by back-to-back arrows in Figure 1.
Two additional points need to be mentioned briefly before going on to the implications of this result. First, the old carbon contribution which was found from the slope of the f=0.17 analysis was 604 radiocarbon years. This is how much apparent age old carbon in Elk Lake contributes to the date of samples which grew in the lake for any time during roughly the past three thousand years.
Second, the above analysis probably slightly overestimates the fraction of missed layers back to the Flood (and thus assigns the Flood layer range at layer numbers which are slightly too low). The analysis is necessarily restricted to the modern lake stage, but about 850 prairie lake layers are also involved in the calculation of the Flood layer. It seems probable that the fraction of layers which were missed by the researchers who did the layer counting was somewhat smaller during the prairie stage, because the annual layers are thicker on average during this stage and, hence, presumably harder to miss. It does not seem worthwhile to pursue this quantitatively however. The correction which might result seems probably only a decade or two at best, and this is adequately covered by the range of 200 layers which I have already allowed. ◇
I have received more correspondence as a result of the "Research in Progress" column of the Volume 2, Number 4 issue of The Biblical Chronologist than any previous issue. In that column I showed how Elk Lake sedimentary data combine with Biblical chronology data to falsify the idea that Noah's Flood was a global cataclysm.
I am not surprised at the volume of mail on this issue. The modern creation-science movement in America has made an enormous investment in the cataclysmic Flood model. It is beyond hope, of course, that a single article in The Biblical Chronologist arguing against this notion could leave all readers feeling completely satisfied.
But I do care very much about those who read this newsletter, and I am quite concerned that your questions be answered honestly and openly. This column provides the best forum I can presently conceive of for accomplishing that goal. So I hope to publish several of the letters I have already received regarding the nature of the Flood in the next few issues of The Biblical Chronologist, and to personally address the questions they raise.
I have also invited Dr. Henry Morris, the most articulate and well known scientific proponent of the cataclysmic Flood model today, to respond to my Volume 2, Number 4 "Research in Progress" article in this column, but he has, unfortunately, declined the offer.
There is sufficient space remaining this issue for just a single letter and response.
Dear Dr. Aardsma,
I just received the July/August issue of The Biblical Chronologist, and I wish to share some thoughts and concerns regarding your research into Noah's flood. I do appreciate your desire to uphold the historicity of the Genesis account of the flood. I also grant you that Whitcomb and Morris made a number of assumptions in their flood model that are not specified in the Biblical text. However, I am puzzled by your apparent advocacy of a tranquil flood model. Even local flooding often has profound geological effects. Consider the "Channeled Scablands" of eastern Washington. It has been demonstrated that the large canyons in this part of Washington resulted from a series of local floods. How then could a flood such as is described in Genesis occur without devastating the surface of the earth?
I have visited Itasca State Park in Minnesota several times, and I fail to see how the Genesis flood could have occurred since the formation of Elk Lake. That entire region is noted for its glacial lakes and thick deposits of glacial till. Even very moderate catastrophism during the Genesis flood would have seriously eroded such a landscape, unless God miraculously protected the landscape from erosion. But would God work miracles to hide the Genesis flood from geological inquiry? I doubt it, as nature itself testifies to God's existence and power. (Romans 1:20)[30]
Of course, many evangelicals have advocated a local flood in the middle east. Such a flood model poses no significant geological problems, but it seems to me that it is ruled out by Genesis 8:4. Mount Ararat is 17,000 feet above sea level, while the Ararat plateau is 6,000 feet above sea level. Only a global flood could raise a ship to such an altitude.
If we are to take the Genesis account literally (and I do), it seems to me that we must conclude two things:
1. The Genesis flood was both world-wide and catastrophic.
2. The Genesis flood occurred prior, not only to the formation of Elk Lake, but to the Wisconsin glaciation which preceded it.
If Elk Lake is indeed approximately 10,000 years old, as the data seem to indicate, then perhaps your earlier hypothesis was correct. Perhaps the Genesis flood occurred 14,000–15,000 years BP. I realize that a strict reading of the chronological data in Genesis does not support this conclusion. However, is it possible that there are very large gaps in the early Genesis genealogies because Moses' knowledge of pre-history was quite superficial? I only propose this hypothesis as a possibility. I'm aware of some of the problems involved with it, but to me, they still seem of lesser magnitude than those associated with either the tranquil or the local flood theories.
Pastor Robert T. Helm
Orleans, IN
Dear Pastor Helm,
Thank you for your letter. Your questions and observations regarding the nature of the Flood are good ones. The task of properly harmonizing Genesis with extra-Biblical data is not an easy one; I greatly value your input and stimulus.
Let me begin with a brief comment on the "Channeled Scablands" of eastern Washington. I agree that these show that floods can do significant geological work (i.e., erode and deposit sediments), but I question whether this shows that Noah's Flood must have done a huge amount of geological work. I am no expert on floods, but from the little reading I have done in this area I get the impression that there have been many floods in recent history which, though they covered large geographical areas and were devastating in terms of loss of human life, did very little by way of erosion. Floods can cause significant erosion, but judging from modern floods, apparently most don't.
There are a number of factors which influence how much geologic work a flood does. These include the slope of the land, vegetative cover, and volume and depth of water. A brief cloudburst on the slopes of a mountain can evidently produce a raging torrent at the base of the mountain capable of moving boulders. In contrast, a week of downpour in the plains will likely only produce a lot of submerged fields and swollen streams.
As I recall, the Scablands are believed to have been formed when some very large lakes breached their natural dams and poured their water out in a torrential stream over the surface of the ground for several days. Is this an appropriate prototype for the whole of Noah's Flood? I don't think it is.
My own feeling at the present time is that the Flood was bound to have had a catastrophic effect in some local areas—wherever conditions happened to be just right. But I also think it was bound to have done very little geologic work in many if not most areas. The Biblical account of the Flood does not seem to describe a global, year-long, torrential, relatively shallow stream type of flood (a global Scablands). Rather, it seems to describe something more like a great world ocean, and as I point out in the lead article this issue, oceans are not characterized by extensive geological work in any short period of time.
I fail to see how a literal interpretation of the Genesis Flood account demands a globally catastrophic (i.e., cataclysmic) Flood. I see how one might be led to infer this, but I define a literal interpretation as accepting what the text explicitly says, not what may be inferred (correctly or incorrectly) from what the text explicitly says. The Bible explicitly says the water covered all of the high mountains which were under all the heavens.[31] We both accept this. But where does the Bible say the Flood produced the geologic column, or even a single stratum of the geologic column, or even a single fossil within the geologic column? Where does the Bible say that the Flood was accompanied by great earthquakes or tidal waves? These ideas can only be arrived at by a process of human reasoning and inference above and beyond what the Bible actually states. I see the cataclysmic Flood idea as inference only, and every indication, as far as chronologically controlled scientific data are concerned, is that the human reasoning process leading to this particular inference is mistaken.
Regarding your chronology questions: I think I have tried as hard as any person alive today to make a cataclysmic Flood model prior to 10,000 years ago work—and my effort did not succeed.
Such an effort is only justified, in my opinion, if we have objective grounds for setting the explicit Biblical chronological data of Scripture aside. Otherwise, obedience to the authority of Scripture seems to me to demand that we allow Biblical chronological data to speak in their plain sense, just as Biblical conservatives have always insisted should be done with the rest of Scripture. Five years ago there seemed to be objective grounds for setting the explicit Biblical chronological data aside. When taken at face value at that time, these data seemed to place the Conquest at about 1410 B.C. and the Exodus at about 1450 B.C., neither of which could find a shred of legitimate support from secular history or archaeology. Worse yet, these data seemed to place the Flood at about 2500 B.C., in the middle of the history of ancient civilizations which carried on with no apparent interruption in their basic culture or mode of life throughout the entire third millennium B.C. In short, Biblical chronological data seemed to yield nonsense for the bulk of ancient history when taken at face value.
It is certainly reasonable and legitimate to seek for some other hermeneutical approach to the chronological data of Scripture than the obvious, plain-sense, literal one in such a situation, and I looked for some alternative, including the possibility of the gaps you mention, as hard as anyone. But the situation changed dramatically when I discovered that one thousand years had been lost from 1 Kings 6:1.[32] Suddenly, the Bible dated the Conquest, not to 1410 B.C., but to 2410 B.C., and the Exodus, not to 1450 B.C., but to 2450 B.C., both of which found immediate, strong corroboration from secular history and archaeology. And the Bible now dated the Flood to 3500 B.C. rather than 2500 B.C., completely removing the flagrant absurdity of a Flood which didn't disturb any of the ancient civilizations of the Middle East.
In short, once allowance had been made for a scribal copy error in 1 Kings 6:1, the Biblical chronological data no longer yielded nonsense. Quite to the contrary, in fact, they suddenly made tremendous sense.
And this suddenly removed any and all objective grounds for setting the explicit Biblical chronological data aside and seeking alternative hermeneutical approaches. Every indication now was that the Biblical chronological data meant precisely what they said in the literal sense.
And this brings us to the center of your comments and questions. The basic reason why we are arriving at differing conclusions regarding the nature and timing of the Flood is because of a different hermeneutical approach to the chronological data of the Bible. I feel that sound hermeneutics now demands that we take these Biblical chronological data literally. As I see it, they are the known, explicitly given, quantities. The geological potency of the Flood, which is never explicitly addressed anywhere in Scripture, must be regarded as the unknown variable.
I also feel that I am as responsible as anyone for causing confusion on this point of hermeneutics. Prior to my discovery of the missing thousand years in 1 Kings 6:1 (and prior to the founding of The Biblical Chronologist) I published a number of items in which I tried very hard to accommodate a cataclysmic Flood prior to 10,000 years ago to the Bible. I trust the brief discussion above clarifies why I did so, and why I can no longer endorse such an effort.
Unfortunately, when we take a literal approach to the chronological data of Scripture, and a rational and honest approach to secular chronological data, the cataclysmic Flood model collapses entirely—as I have demonstrated from the Elk Lake data, for example.
In hindsight, it is clear that this outcome was more or less inevitable. I have previously pointed out that any approach to harmonizing Biblical and secular data which minimizes the significance of chronological data is a recipe for disaster—that one inevitably winds up with historical fiction when historical facts are assembled to tell a story without regard for their proper placement on the time line. (Recall: Rule #1 Chronology must precede history.)[33] As I now go back and read Whitcomb's and Morris' influential book, The Genesis Flood,[34] some twenty years after I first read it, what strikes me is how cut off from any and all chronological control their synthesis of Biblical and secular data is. Chronological data is only ever discussed in their book to explain why it should, in their opinion, be set aside. This is true not only of the secular chronological data, but of the Biblical chronological data as well (see their Appendix II). No model of earth history, erected on such a foundation, can long endure.
Gerald E. Aardsma, Ph.D.
Loda, IL
The Biblical Chronologist is a bimonthly subscription newsletter about Biblical chronology. It is written and edited by Gerald E. Aardsma, a Ph.D. scientist (nuclear physics) with special background in radioisotopic dating methods such as radiocarbon. The Biblical Chronologist has a threefold purpose: to encourage, enrich, and strengthen the faith of conservative Christians through instruction in Biblical chronology, to foster informed, up-to-date, scholarly research in this vital field within the conservative Christian community, and to communicate current developments and discoveries in Biblical chronology in an easily understood manner. An introductory packet containing three sample issues and a subscription order form is available for $9.95 US regardless of destination address. Send check or money order in US funds and request the "Intro Pack." The Biblical Chronologist (ISSN 1081-762X) is published six times a year by Aardsma Research & Publishing, 412 N Mulberry, Loda, IL 60948-9651. Copyright © 1996 by Aardsma Research & Publishing. Photocopying or reproduction strictly prohibited without written permission from the publisher.
|
^ Gerald E. Aardsma, "Research in Progress," The Biblical Chronologist 2.4 (July/August 1996): 9–14.
^ See, for example: John C. Whitcomb, Jr. and Henry M. Morris, The Genesis Flood (Philadelphia: The Presbyterian and Reformed Publishing Company, 1961).
^ See, for example: Arthur C. Custance, The Flood: Local or Global? (Grand Rapids: Zondervan, 1979).
^ Genesis 7:20.
^ John C. Whitcomb, Jr. and Henry M. Morris, The Genesis Flood (Philadelphia: The Presbyterian and Reformed Publishing Company, 1961), 1–35.
^ Genesis 8:1.
^ Gerald E. Aardsma, "Research in Progress," The Biblical Chronologist 1.1 (January/February 1995): 6–7; Gerald E. Aardsma, "Research in Progress," The Biblical Chronologist 1.2 (March/April 1995): 6–8; Gerald E. Aardsma, "Research in Progress," The Biblical Chronologist 1.4 (July/August 1995): 6–10.
^ Gerald E. Aardsma, "Chronology of the Bible: 5000–3000 B.C.," The Biblical Chronologist 2.4 (July/August 1996): 2–3.
^ Roger Y. Anderson, "The varve chronometer in Elk Lake: Record of climatic variability and evidence for solar-geomagnetic-14C-climate connection," Elk Lake, Minnesota: Evidence for Rapid Climate Change in the North-Central United States, ed. J. Platt Bradbury and Walter E. Dean (Boulder: The Geological Society of America, Inc., 1993), 45–46.
^ Patrick J. Bartlein and Cathy Whitlock, "Paleoclimatic interpretation of the Elk Lake pollen record," Elk Lake, Minnesota: Evidence for Rapid Climate Change in the North-Central United States, ed. J. Platt Bradbury and Walter E. Dean (Boulder: The Geological Society of America, Inc., 1993), 288–289.
^ J. Platt Bradbury and Walter E. Dean, ed., Elk Lake, Minnesota: Evidence for Rapid Climate Change in the North-Central United States (Boulder: The Geological Society of America, Inc., 1993).
^ Cathy Whitlock, Patrick J. Bartlein, and William A. Watts, "Vegetation history of Elk Lake," Elk Lake, Minnesota: Evidence for Rapid Climate Change in the North-Central United States, ed. J. Platt Bradbury and Walter E. Dean (Boulder: The Geological Society of America, Inc., 1993), 258.
^ J. Platt Bradbury, Walter E. Dean, and Roger Y. Anderson, "Holocene climatic and limnologic history of the north-central United States as recorded in the varved sediments of Elk Lake, Minnesota: A synthesis," Elk Lake, Minnesota: Evidence for Rapid Climate Change in the North-Central United States, ed. J. Platt Bradbury and Walter E. Dean (Boulder: The Geological Society of America, Inc., 1993), 318.
^ Barbara A. Zeeb and John P. Smol, "Postglacial chrysophycean cyst record from Elk Lake, Minnesota," Elk Lake, Minnesota: Evidence for Rapid Climate Change in the North-Central United States, ed. J. Platt Bradbury and Walter E. Dean (Boulder: The Geological Society of America, Inc., 1993), 247.
^ This result is calculated as follows. Lines 9 and 11 of Table 1 (above) show the published radiocarbon ages for annual layers on either side of these 600 layers. For layer 2,731 (modern lake stage) the radiocarbon age is 3,510±90 years B.P. and for layer 5,654 (prairie lake stage) it is 5,290±100 years B.P. The old carbon contribution for the prairie lake stage is not known. However, it seems unlikely that it would differ by more than one or two hundred years from the modern lake stage. For the present calculation it is adequate to approximate the old carbon contribution for the prairie lake stage with the value computed for the modern lake stage (i.e., 605 years; see Appendix). Subtracting an old carbon age of 605 years in both cases and calibrating the residual radiocarbon ages using CALIB rev3.0.3 yields calendar dates of 1092±163 B.C. and 3489±138 B.C. Thus the calendar difference in these two layers computed using these two radiocarbon measurements is (3489±138 - 1092±163 =) 2397±214 years.
The layer number difference is (5,654 - 2,731 =) 2923, but it is not appropriate to use this difference in the present calculation since it is shown in the Appendix that approximately 17% of annual layers were missed in the layer counting process. Excluding the 600 layers in question from this readjustment yields a layer count difference of (1.17×(2923-600) + 600 =) 3,318 layers.
Thus radiocarbon shows (3318 - 2397±214 =) 921±214 fewer calendar years spanning this anomalous section of the core than the direct count of layers indicates.
^ Cathy Whitlock, Patrick J. Bartlein, and William A. Watts, "Vegetation history of Elk Lake," Elk Lake, Minnesota: Evidence for Rapid Climate Change in the North-Central United States, ed. J. Platt Bradbury and Walter E. Dean (Boulder: The Geological Society of America, Inc., 1993), 259.
^ J. Platt Bradbury, Walter E. Dean, and Roger Y. Anderson, "Holocene climatic and limnologic history of the north-central United States as recorded in the varved sediments of Elk Lake, Minnesota: A synthesis," Elk Lake, Minnesota: Evidence for Rapid Climate Change in the North-Central United States, ed. J. Platt Bradbury and Walter E. Dean (Boulder: The Geological Society of America, Inc., 1993), 312 (graph).
^ Cathy Whitlock, Patrick J. Bartlein, and William A. Watts, "Vegetation history of Elk Lake," Elk Lake, Minnesota: Evidence for Rapid Climate Change in the North-Central United States, ed. J. Platt Bradbury and Walter E. Dean (Boulder: The Geological Society of America, Inc., 1993), 256.
^ Cathy Whitlock, Patrick J. Bartlein, and William A. Watts, "Vegetation history of Elk Lake," Elk Lake, Minnesota: Evidence for Rapid Climate Change in the North-Central United States, ed. J. Platt Bradbury and Walter E. Dean (Boulder: The Geological Society of America, Inc., 1993), 259.
^ Roger Y. Anderson, "The varve chronometer in Elk Lake: Record of climatic variability and evidence for solar-geomagnetic-14C-climate connection," Elk Lake, Minnesota: Evidence for Rapid Climate Change in the North-Central United States, ed. J. Platt Bradbury and Walter E. Dean (Boulder: The Geological Society of America, Inc., 1993), 46.
^ J. Platt Bradbury, Walter E. Dean, and Roger Y. Anderson, "Holocene climatic and limnologic history of the north-central United States as recorded in the varved sediments of Elk Lake, Minnesota: A synthesis," Elk Lake, Minnesota: Evidence for Rapid Climate Change in the North-Central United States, ed. J. Platt Bradbury and Walter E. Dean (Boulder: The Geological Society of America, Inc., 1993), 318.
^ Patrick J. Bartlein and Cathy Whitlock, "Paleoclimatic interpretation of the Elk Lake pollen record," Elk Lake, Minnesota: Evidence for Rapid Climate Change in the North-Central United States, ed. J. Platt Bradbury and Walter E. Dean (Boulder: The Geological Society of America, Inc., 1993), 275–293.
^ J. Platt Bradbury, Walter E. Dean, and Roger Y. Anderson, "Holocene climatic and limnologic history of the north-central United States as recorded in the varved sediments of Elk Lake, Minnesota: A synthesis," Elk Lake, Minnesota: Evidence for Rapid Climate Change in the North-Central United States, ed. J. Platt Bradbury and Walter E. Dean (Boulder: The Geological Society of America, Inc., 1993), 319.
^ Gerald E. Aardsma, "Chronology of the Bible: 5000–3000 B.C.," The Biblical Chronologist 2.4 (July/August 1996): 2–3.
^ Roger Y. Anderson, J. Platt Bradbury, Walter E. Dean and Minze Stuiver, "Chronology of Elk Lake sediments: Coring, sampling, and time-series construction," Elk Lake, Minnesota: Evidence for Rapid Climate Change in the North-Central United States, ed. J. Platt Bradbury and Walter E. Dean (Boulder: The Geological Society of America, Inc., 1993), 40.
^ Donald R. Sprowl, "On the precision of the Elk Lake varve chronology," Elk Lake, Minnesota: Evidence for Rapid Climate Change in the North-Central United States, ed. J. Platt Bradbury and Walter E. Dean (Boulder: The Geological Society of America, Inc., 1993), 72.
^ Donald R. Sprowl, "On the precision of the Elk Lake varve chronology," Elk Lake, Minnesota: Evidence for Rapid Climate Change in the North-Central United States, ed. J. Platt Bradbury and Walter E. Dean (Boulder: The Geological Society of America, Inc., 1993), 74
^ Roger Y. Anderson, J. Platt Bradbury, Walter E. Dean and Minze Stuiver, "Chronology of Elk Lake sediments: Coring, sampling, and time-series construction," Elk Lake, Minnesota: Evidence for Rapid Climate Change in the North-Central United States, ed. J. Platt Bradbury and Walter E. Dean (Boulder: The Geological Society of America, Inc., 1993), 41.
^ Minze Stuiver and Bernd Becker, "High-precision decadal calibration of the radiocarbon time scale, AD 1950–6000 BC," Radiocarbon, 35.1 (1993): 57–65.
^ "For since the creation of the world His invisible attributes, His eternal power and divine nature, have been clearly seen, being understood through what has been made, so that they are without excuse." (NASB)
^ Genesis 7:19.
^ Gerald E. Aardsma, A New Approach to the Chronology of Biblical History from Abraham to Samuel, 2nd ed. (Loda IL: Aardsma Research and Publishing, 1993).
^ Gerald E. Aardsma, "Biblical Chronology 101," The Biblical Chronologist 2.3 (May/June 1996): 10.
^ John C. Whitcomb, Jr. and Henry M. Morris, The Genesis Flood (Philadelphia: The Presbyterian and Reformed Publishing Company, 1961).