|
|
|
|
|
|
|
Home
About
Resources
anti-aging vitamins books
- A New Approach...
- The Exodus Happened 2450 B.C.
- Noah's Flood Happened 3520 B.C.
- Age of the Earth Collection
- Aging: Cause and Cure
- Bread from Heaven: The Manna Mystery Solved
newsletters
podcast
speaker for an event
time charts
videos
Topics
Overview
Biblical Chronology Dendrochronology Radiocarbon Dating Mt. Sinai Jericho Ai The Exodus Noah's Ark Imhotep/Joseph
Correspondence
- anti-aging vitamins
- antiquity of mankind
- ark search
- Bible chronology
- "The BC" publication
- Bryant Wood's critique
- calendars
- Heshbon
- horses and chariots in Egypt
- Jericho --- Joshua's curse
- lifespan research
- missing millennium: reception
- missing millennium: textual
- Mt. Sinai
- Noah's Flood
- Philistines
- radiocarbon
- Sodom and Gomorrah
- teaching science and creation
- the Exodus
- tree rings
- virtual history
- young earth creation
Contact Us
Correspondence: Anti-aging VitaminsJuly 30, 2019Dear Dr. Aardsma,I looked through the Addendum to Aging: Cause and Cure. I was curious why you didn't publish any statistics for the survival curves. I would like to see the results of your null hypothesis testing---for example, a log-rank test, or a Cox proportion hazard test, or a 95% confidence interval test.
Thanks, August 5, 2019Hello James,I did no formal statistical analysis in this case because there seemed nothing to be gained by it relative to what one can immediately see from the graph. We are interested in the question of whether the (red) MePiA curve of Figure 5, page 9 of the addendum (reproduced below) displays life-lengthening signal or just noise. Visually, the impression is, pretty strongly, that it displays signal. 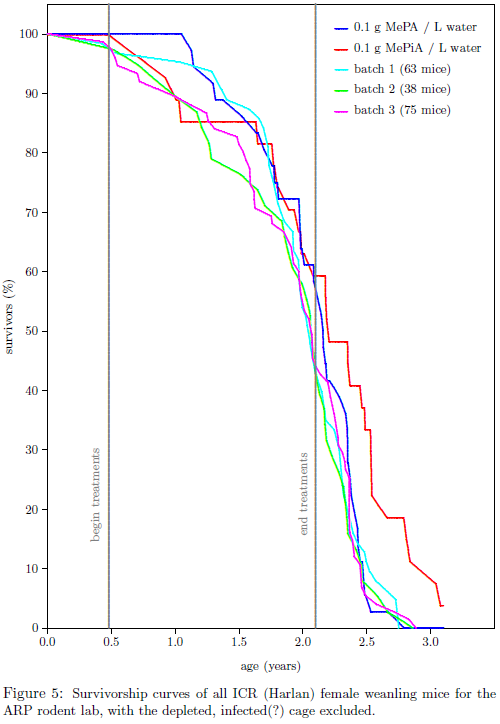
Turning to objective statistics, the hypothesis is that red (the cohort of MePiA mice) has benefited from anti-aging, reducing its rate of mortality (and thereby enhancing its survivability) relative to all other treatments of ICR weanling female mice raised in ARP lab. The null hypothesis is that there is no difference in survivability between red and the others. Is there a statistically significant difference between the red lines and the other four lines? Subjective visual evaluation can be objectively spot checked at various % survivors. I spot checked at 0% survivors, for example, as follows. For batch 1, age at 0% survivors (i.e., when the last batch 1 mouse died) was 143.3 weeks. Batch 2 was 149.1 weeks. Batch 3 was 150.4 weeks. Blue was 145.4 weeks. The mean and standard deviation for 0% survivors of not red mice is easily calculated from these numbers and found to be 147.1 +/- 3.3. The last red mouse is still living. Pretend she died today. This gives the red age at 0% survivors as 165.4 weeks. We have no way of calculating a standard deviation for last surviving red because we have only one red line. But we may reasonably assign a standard deviation to red based on the calculated sample standard deviation of the other four curves. This results in a standard deviation for red at 0% survivors of 3.3 * sqrt(4-1) = 5.7. Is 165 +/- 5.7 statistically different from 147.1 +/- 3.3? The difference between these two numbers is 18.4 +/- 6.6. This is 2.8 standard deviations removed from 0. Since 2 standard deviations corresponds to a 95% confidence interval, the null hypothesis seems reasonably rejected at 0% survivors. For spot checks at 11%, 22%, 33%, 44%, and 55% survivors, I find 8.7, 3.5, 1.6, 2.9, and 1.3 standard deviations removed from zero difference. Thus, the null hypothesis may objectively be rejected for at least the final 22% of survivors. This is just another way of saying that the red line appears to show real life-lengthening signal, not just noise. Trust this helps.
Sincerely, August 6, 2019Yes, that helps. 2.8 standard deviations is more than adequate to show statistical significance.
Thanks, |