A New Approach to the Chronology of Biblical History from Abraham to Samuel.  112 pages. $29.95. Click for details. The Exodus Happened 2450 B.C.  94 pages. $29.95. Click for details. Noah Aging: Cause and Cure.  143 pages. Free download. Click for details. Bread from Heaven: The Manna Mystery Solved. 111 pages. Click for details.
 
  Advanced Search
Sign Up

Home

About

Resources
anti-aging vitamins books manna
newsletters
podcast
speaker for an event
time charts
videos
Topics
Overview
Biblical Chronology Dendrochronology Radiocarbon Dating     Mt. Sinai Jericho Ai The Exodus Noah's Ark Imhotep/Joseph
Correspondence

Contact Us

BC Volume 3 (1997)


Volume 3, Number 1January/February 1997

Chronology of Noah's Flood

In the previous issue of The Biblical Chronologist I focused on sedimentary data from Elk Lake which seem to testify to the presence of Noah's Flood in North America at approximately 3520 B.C. This discovery adds to the already substantial mound of evidence that a millennium was accidentally dropped from the text of 1 Kings 6:1 in antiquity.[1] It also launches the field of Biblical chronology into a search for additional evidences of Noah's Flood in other natural reservoirs of chronologically controlled, geophysical data. Potentially suitable reservoirs for searching include, for example, polar ice sheets, tree-rings, and additional lake sediments from around the world.

As this search begins it is important to have in mind the most accurate picture possible of what Noah's Flood was like. For this search one would like to know, for example, whether it is reasonable to expect the Flood to have been recorded by the bristlecone pine trees which have grown for millennia in the White Mountains of California. What would the Flood be expected to look like in the tree-ring chronology which has been derived from these trees? The answer to this question obviously depends on what the Flood was like in the White Mountains. Did the precipitation which accompanied the Flood fall as rain or snow in this high altitude region? How long would the bristlecones likely have been inundated by the Flood? During what season or seasons of the year would they have been inundated? Clearly, the more knowledge about the Flood we can take with us into the present search, the more successful the search for the Flood in these geophysical reservoirs is likely to be.

Many of the questions about the Flood which arise at the present time can not be answered with any degree of certainty. It is to be expected, in fact, that the present search will itself add significantly to our knowledge of the Flood. But a few questions about the Flood can be answered with a high degree of reliability even now, and at least a probable answer can be given to many others. This results mainly from the record of Noah's observations of the Flood which is preserved for us in the seventh and eighth chapters of Genesis.

Noah's Calendar

The narrative of the Flood found in Genesis chapters 7 and 8 contains a number of very important time references. For example, in Genesis 7:11 we read (NASB):

In the six hundredth year of Noah's life, in the second month, on the seventeenth day of the month, on the same day all the fountains of the great deep burst open, and the floodgates of the sky were opened.

Such time references constitute the basis for the historical chronology of the Flood event. However, these are obviously not references to the Gregorian calendar which we now employ for keeping track of days, weeks, months, and years, since it was only in A.D. 1582 that the Gregorian calendar came into existence. There have been many different calendars in antiquity, and the fact is that we do not know what calendar Noah used. Most importantly for the present study, we do not know how many days were in each of its months, and we do not know how many months comprised a year.

These basic unknowns give rise to an unavoidable uncertainty in any attempt to fix the events of the Flood on the time line. However, variations in ancient calendar systems of the Middle East are sufficiently small to suggest that even in the worst case a cumulative error of only one or two weeks should be expected from any reasonable modern rendering of the chronology of the Flood.

While we do not know the lengths of a year or of the months in Noah's calendar, it seems highly probable that they were linked to observed natural phenomena. "Day" is naturally defined as a single period of light and darkness, caused by the rotation of the earth on its axis. "Month" finds its most natural definition in the revolution of the moon about the earth, a new month beginning with the first appearance of a crescent moon at dusk following its complete absence at night due to its close alignment with the sun (Figures 1 and 2). And similarly "year" finds its most natural definition in the revolution of the earth about the sun which gives rise to the observed annual cycle of seasons.

Figure 1: The relative positions of sun, moon, and earth during the new moon phase. The rotational axis of the earth is perpendicular to the page, and the figure is viewed from above the north pole. Nothing is to scale.

Figure 2: The phases of the moon from one new moon to the next. From left to right these are called: new, crescent, first quarter, gibbous, full, gibbous, last quarter, crescent, and new. The first appearance of the crescent following the new moon is a point in this cycle which can be determined with relatively little ambiguity. Hence it serves as a good point from which to begin successive lunar months. At this point the moon is viewed at dusk, setting in the west, shortly after the sun has gone down.

These natural definitions—which I will assume were the ones Noah used as I draft the following chronology of the Flood—though lacking in quantitative precision relative to modern scientific standards, would almost certainly function adequately for the day-to-day activities of people in the pre-Flood world. In fact, they seem to have been the original starting point from which all calendars of the Middle East in the post-Flood era were later devised. They are also obviously harmonious with the Divine purpose, articulated at Creation, that the sun, moon, and stars should be "for seasons, and for days and years".[2]

These natural definitions have several interesting consequences. For example, they imply that the concept of "year" would be attached to the natural cycle of seasons rather than to any arbitrary count of days. Thus, the number of days comprising a year could vary slightly from year to year, but the long-term average would equal the mean solar year, which measures 365.2422 days at present. An important result is that the measured "years" of Noah's life recorded in Scripture, as well as those of the other pre-Flood patriarchs, would probably approximate solar years just about as closely as the "years" of our lives do according to current calendrical practices.

Unlike our modern calendar, however, one year would not divide neatly into twelve months. The observed period from one new moon to the next is called the synodic month. The synodic month is variable, but averages 29.530588 days. Twelve synodic months equals 354.3671 days, which is 10.8751 days short of a solar year. Thus, in this natural system of reckoning time, months would not be expected to be synchronized with the solar year at all.

In actual practice, with the beginning of each new month determined by observation, months would also vary in length between 29 and 30 days in an irregular way. However, the long-term average would equal the average synodic month of 29.530588 days.

This all seems somewhat complicated, no doubt, but it amounts to a very simple and natural way of reckoning time in actual practice. For example, in this system Genesis 7:11, quoted above, simply means that the Flood began on the seventeenth day following the second new moon to be observed by Noah (or his contemporaries) in his six hundredth year.

Throughout the remainder of this article I will present such dates in the format "year of Noah's life/lunar month/day of month". In this format the calendar date in Genesis 7:11 is written as 600/02/17.

Day Counts

Several "day counts" are used in place of calendar dates in the Biblical narrative of the Flood: the initial forty days and nights of rain, the 150 days during which the Flood prevailed, and several counts in connection with the sending out of the birds from the ark. This is to be expected in such a natural calendar system. The presence of such counts supports the suggestion that this was the calendar which Noah actually employed.

According to the lunar calendar postulate, Noah's calendar depended on his being able to see the new moon, to mark the beginning of each month. Obviously, this would not always have been possible. For example, it would not have been possible during the forty days and nights of rain at the beginning of the Flood. While Noah would easily have been able to keep a running tally of how many days it had rained, he would not have been able to give an accurate calendar date for when the rain stopped. The rain itself would have prevented observation of the moon and, hence, it would have prevented determination of the exact day when the third month began. I suggest that this is the reason Noah recorded the number of days it rained, rather than the calendar date when the rain stopped.

Visibility

Further support of the lunar, observational calendar thesis results from another, somewhat opposite observation. There are two calendar dates in the Flood narrative which, in a lunar calendar, would necessarily coincide with the appearance of the new moon: 600/10/01 in Genesis 8:5 and 601/01/01 in Genesis 8:13. If the lunar calendar thesis is correct, then atmospheric conditions on these two days would need to have been sufficiently clear for the new moon to be observed, to tell that the new month had begun.

In actual fact, in both instances observations are recorded which seem to imply clear conditions. Visibility was obviously good on 600/10/01, for Genesis 8:5 tells us that on that day the tops of neighboring mountains were seen. Similarly, on 601/01/01 Noah removed the covering of the ark and observed that "the surface of the ground was dried up". Presumably this "surface of the ground" is a reference to the plane below the mountain upon which the ark had come to rest, since Noah would already have known the surface of the ground on the mountain itself was dry, both from the appearance of the neighboring mountains whose tops had become visible two months previously, and from his dove experiments. Thus, good visibility is again implied.

Duration of the Flood

No matter what calendar one assumes Noah used, the total duration of the Flood was obviously about one year. The Flood began on the seventeenth day of the second month of Noah's six hundredth year (Genesis 7:11), and Noah and his family disembarked after the Flood on the twenty-seventh day of the second month of his six hundred and first year (Genesis 8:13–19).

Interestingly, however, when the natural calendar I have described above is assumed, the duration of the Flood comes out to be exactly 365 days. This, of course, is the length of the solar year (i.e., 365.2422 days) rounded to the nearest whole number of days.[3]

Thus it appears possible that the Scriptures mean to convey that Noah and his family were aboard the ark exactly one year.

This conclusion may find additional support from the Septuagint version of the Old Testament. Its reading of Genesis 7:11 and 8:14 is essentially the same as the reading of the Hebrew text (from which our English Bibles derive) with the single exception that in the Septuagint the Flood begins, not on the seventeenth day of the second month, but on the twenty-seventh day. This causes the Flood to both begin and to end on the same day of the same month of consecutive years. For those, like ourselves, who use a solar based calendar, events which begin and end on the same day of the same month separated by one year are immediately recognized to be one year long. I suggest the Septuagint reading in Genesis 7:11 may have been deliberately changed from "seventeenth day" of the Hebrew text to "twenty-seventh day" of the Septuagint for precisely this reason. I suggest that the Septuagint audience may have been familiar with a solar rather than a lunar calendar, and that Genesis 7:11 may have been changed in the Septuagint to communicate to this audience the fact that Noah and his family were aboard the ark exactly one year.

I have previously shown that the date of the commencement of the Flood appears, from Biblical data, to be 3520±21 B.C.[4] We must, therefore, date the disembarking from the ark to 3519±21 B.C.[5] These dates provide a functional chronological alignment of the Flood with respect to world history, as well as adequate boundaries for containment of the more detailed events of the Flood.

Detailed Chronology of the Flood

I have arranged the events of the Flood, recorded in Genesis chapters 7 and 8, in the time chart shown in Figure 3. The absolute (B.C.) dates discussed above are shown above and below the chart. This placement is deliberately chosen to convey the idea that precise alignment of the chart with respect to the Gregorian calendar months is presently unknown.

Figure 3: Chronology of Noah's observations of the Flood.

The time scale is given in the leftmost column of the figure as a day number count. In the neighboring column to the right I have placed Noah's date references at their appropriate day number. These are given in the format "year of Noah's life/lunar month/day of month" as mentioned above.

The Flood Begins

Genesis 7 opens with God's command to Noah and his family to enter the ark and board the animals. This command was given seven days prior to the beginning of the Flood.

Once Noah and his family had been shut safely inside, the Flood began on 600/02/17, evidently with nonstop rain and the simultaneous rising up of water from the oceans onto the land. This release of water over what had previously been dry land continued for forty days.

An Interpretive Interlude

Sedimentary data from Elk Lake in Minnesota strongly support the global Flood interpretation of Genesis 7 and 8.[6] But interpretive questions regarding the geographical extent of phenomena associated with the Flood still arise within the global Flood framework. For example, did the forty days and nights of rain, first mentioned in Genesis 7:4, fall everywhere all over the earth, or was this particular manifestation of the Flood peculiar to Noah's region?

Such questions are of considerable importance at present. Obviously, forty days and nights of precipitation would be expected to leave a marked effect on the Greenland ice sheet for example.[7] Forty days and nights of rain would be expected to produce some significant melt-back of the uppermost snow and ice layers, and the penetration of meltwater into cracks and fissures and subsequent refreezing would probably alter the physical character of the underlying ice to some depth as well.

Forty days and nights of snow would have somewhat of an opposite effect. It would be expected to produce an unusually thick annual ice layer, but would not be expected to disturb the stratigraphic sequence of layers or to alter the usual physical characteristics of underlying ice in any way.

Clearly, if we can be certain from the text of Scripture that the forty days and nights of precipitation was a global phenomenon, then the Greenland ice sheet would be virtually guaranteed to strongly reveal the Flood in its vast record of annual snow accumulation in Greenland.

One may or may not feel certain about this scientific question (of the geographical extent of phenomena associated with the Flood) depending upon how they view the overall context of Genesis chapters 7 and 8. If one adopts the perspective that Genesis 7 and 8 record God's omniscient, omnipresent observations of the Flood, then many of the phenomena mentioned in these chapters appear to be global. If, however, one adopts the perspective that Genesis 7 and 8 record Noah's accurate but finite observations of the Flood, then one finds that the question of the geographical extent of many of the phenomena mentioned in Genesis 7 and 8 cannot be settled with certainty from the Biblical text alone.

I personally lean very heavily toward the latter perspective. My reason for this comes out of my study of these chapters over several decades. I have come to see Noah as somewhat of an early scientist—his ability to construct such a vessel as the ark, his ability to care for the many different types of animals which God sent to him, and his design and execution of the bird experiments all contribute to this impression—and, as a scientist myself, I find it difficult to escape the feeling that I am simply reading observations which Noah jotted down in his science notebook through much of Genesis 7 and 8. I would add to this that the referencing of calendar dates to Noah's own birthday adds further to the impression that these are, in fact, Noah's personal observations of the Flood. In any event, I feel the reader needs to be aware that this perspective underlies and permeates the following discussion.

An important consequence of this perspective is that the chronology of the Flood, shown in the time chart of Figure 3, can not be applied simultaneously to every point on the surface of the globe. This is understood to be the chronology of Noah's experience of the Flood, not a universal chronology of the Flood equally applicable to the whole globe.

For example, the observation that the tops of the mountains became visible on 600/10/01 does not mean that one would have first observed mountains on that day no matter where they were situated on the earth. Similarly, the forty days and nights of rain must be regarded as a local, rather than a global observation. This by no means precludes the possibility of forty days and nights of rain elsewhere on the globe or even over the entire globe—what Noah observed locally may have been part of a global phenomenon. Indeed, as we have seen, the Flood itself, though only locally observed by Noah, certainly appears to have been a global phenomenon. The forty days and nights of rain may also have been a global phenomenon, but it appears to me to be an interpretive error to jump to this conclusion on the basis of the Biblical account of the Flood alone.

The Water Prevails

The word "prevailed" occurs three times in the last seven verses of Genesis chapter 7. This word is used each time in reference to the water of the Flood—we are told that the water prevailed 150 days. What does this mean?

The same Hebrew word is used of the battle between the Israelites and the Amalekites in the desert of Sinai after Israel had left Egypt. This battle, recorded in Exodus 17, is the one in which "it came about when Moses held his hand up, that Israel prevailed, and when he let his hand down, Amalek prevailed".

I suggest that the use of "prevailed" in Genesis 7 has the same connotation as its use in Exodus 17. That is, Noah has in mind the metaphor of a mighty struggle between the dry land and the water. From the first day until the one hundred fiftieth day of the Flood the water appeared to be winning the battle, but from day 150 onward the earth was winning.

The event which marked the turning point in this struggle appears to have been the grounding of the ark on the mountain. Even though the view from the window of the ark would have revealed only water at this point, as it had for many months previously, contact with terra firma had been reestablished. When the ark failed to lift off the mountain again, but rather proceeded to slowly settle in place, no doubt accompanied with some tilting of the decks, it would be clear to Noah that the Flood was waning and the water was winning no longer.

This suggests that the day count given in Genesis 7:24, informing us that "the water prevailed upon the earth one hundred and fifty days" should coincide with the calendar date of 600/07/17 given in Genesis 8:4 for the grounding of the ark upon the mountain. This, in fact, works out very well. It requires only that four of the five synodic months which completed between the start of the Flood on 600/02/17 and the grounding of the ark on 600/07/17 had thirty days and one had twenty-nine days. In his Handbook of Biblical Chronology Jack Finegan displays a table of the actual month lengths recorded during the first nineteen years of the reign of Nebuchadrezzar II of Babylon.[8] I found twenty-four occurrences of five consecutive months in which four were thirty days long and the remaining one was twenty-nine days long in this table.[9] Thus, it appears correct to equate the calendar date, 600/07/17, with day 150 even though the text does not explicitly do so.

The Flood Subsides

As noted above, the turning point in the narrative of the Flood occurs when the ark is grounded in the mountains of Ararat. From that point on it is clear to Noah that the Flood is in retreat.

On 600/10/01 the tops of neighboring mountains become visible for the first time. The impression from Genesis 8:5 is that this is due to the Flood decreasing sufficiently for the tops of neighboring mountains to finally poke out above the surface of the Flood water, like the Pacific islands which poke out above the surface of the Pacific ocean today.

Forty days later Noah began his series of bird experiments. The purpose of these experiments was clearly to ascertain living conditions outside the ark, as noted by many commentators.

Neither a date nor a day count is given in relation to the sending out of the first dove. However, Genesis 8:10 says in relation to the sending of the dove the second time, "So he waited yet another seven days; and again he sent out the dove from the ark". This seems to imply that there was a seven day interval between the sending of the raven and the sending of the dove the first time. I have assumed this is the case in the time chart of Figure 3.

The day counts given in relation to the sending out of the raven and doves (Genesis 8:6–12), and absence of calendar dates for these experiments, may indicate that observation of the new moon was obscured by overcast conditions for both the eleventh and twelfth months. I must emphasize that the use of a lunar calendar has been assumed, not proven, and the idea that day counts are given in place of calendar dates at some points in the narrative due to Noah's inability to observe the new moon on certain days is inference, not fact. Nonetheless, it is somewhat fascinating to observe that if this assumption and this inference are correct, then they allow us to deduce meteorological conditions on certain days during the Flood, even though those conditions are not explicitly given by the narrative and even though those days are five and a half thousand years remote from us.

On another tack altogether, notice that the date reference, 601/01/01, on which the covering of the ark was removed, probably does not refer to Noah's six hundred and first birthday. Rather, in the calendar assumed here, it means merely the day in which the first new moon of Noah's six hundred and first year was observed. Noah could have turned 601 anywhere during the preceding lunar month.

Disembarking

One of the most fascinating aspects of the chronology of the Flood, belying the prevalent modern notion that the Flood narrative is myth, is Noah's obvious timidity about leaving the ark. This is not explicitly mentioned in the narrative, but it comes through pretty clearly when the chronology of the Flood is considered.

One can imagine that conditions inside the ark were not all that pleasant. The ark is often pictured as something of a happy floating zoo in children's story books, but a floating barn would probably be a more accurate image. Practical considerations suggest the ark was probably a rather smelly place soon after the animals had boarded, and that it only got worse with time. Yet, even though Noah learned from his third experiment with the dove that conditions were livable outside the ark, he still waited another twenty-seven days before venturing to remove the covering of the ark on 601/01/01 to get some fresh air and have a good look around outside. And even though, having done so, he could now plainly see that the earth was dry all around, he still remained in the ark another fifty-five days—nearly two months—until God Himself commanded him to leave.

The implication here seems clear. Obviously, apart from a special revelation from God, Noah had no way of knowing whether the Flood was over. In the absence of such a revelation he was clearly fearful that the Flood which had swallowed the world so quickly and completely once might suddenly return to do so again. His strategy was obviously "better safe than sorry", even if it meant having to cope with a considerable degree of unpleasantness.

And in due time, on 601/02/27, the special revelation Noah needed was given, and Noah, his family, and the animals disembarked at long last. The ark had done its job, sheltering them successfully for 365 days. The year of God's judgment was now past, and they had God's promise that there would never again be another year like it:[10]

While the earth remains,
Seedtime and harvest,
And cold and heat,
And summer and winter,
And day and night
Shall not cease.

Readers Write

Research Thrust

Dear Dr. Aardsma,

Will your research be primarily in the area of pre-Davidic history, or will you ever touch on other topics? I am thinking of more common historical debates such as the chronology of the life of Christ, early New Testament church, post-Davidic events, and the dating of when certain prophets wrote their books.


Karl Wiensz
Rickreall, OR


Dear Karl,

Some time ago I made a poster and hung it up by my desk in my office. It is designed to keep me on track. It looks like this:

Because there is no real conflict between Biblical and secular chronologies in the post-Davidic period, my research into chronological matters from 1000 B.C. to the present is likely to be minimal for some time to come.

There is, as I am sure you know, a rather large conflict between traditional Biblical chronology and secular chronologies of earth history relative to the antiquity of man and the age of the earth. The Bible seems to date the creation of Adam to around 5000 B.C. Meanwhile, archaeologists have uncovered whole towns which appear to predate this by at least 3,000 years, and the age of the earth itself is currently estimated at 4.5 billion years.

Radiometric methods form almost the entire basis of secular chronologies prior to 3000 B.C. My formal physics training has equipped me to understand, properly respect, and critically evaluate these methods. It is in relation to these methods that I feel I can contribute most to Biblical chronology issues. The role played by radiometric dating methods in secular chronology building diminishes as one moves from 3000 B.C. toward the present. Thus, my particular background is best suited to Biblical chronology issues prior to about 1000 B.C.

The strategy for my research is to systematically extend the region of harmonization between sacred and secular chronologies of earth history to ever earlier times. A decade ago there was no harmony prior to 1000 B.C. At present the frontier has been pushed back to 3500 B.C.—the Lord has clearly blessed!

But, as my poster shows, Genesis 1:1 is the ultimate objective. So you should expect my research to concentrate on the present frontier and press toward ever more remote times. I would expect to treat post-Davidic matters only rarely.


Gerald E. Aardsma, Ph.D.
Loda, IL

Noah's Flood

The following letter was written in October 1996, in reference to the "Research in Progress" column of the July/August 1996 issue of The Biblical Chronologist (Volume 2, Number 4). In that column I showed how sedimentary data from Elk Lake in Minnesota combine with Biblical chronology data to falsify the idea, popularized by the creation/science movement in the U.S. during the past several decades, that Noah's Flood was a great overwhelming geologic upheaval in which the surface of the earth was torn apart and demolished to great depth. Not surprisingly I received a number of letters from concerned subscribers arguing for the cataclysmic model. The following letter is another of this set to be published in this column. My purpose in publishing these is to provide for open, candid discussion of the cataclysmic model.


Dear Dr. Aardsma,

Your article on the Noahic Flood in the latest issue of The Biblical Chronologist has given rise to a number of questions. Maybe I should wait for the next installment before writing, but these questions weigh heavily upon me. I have done no specific research for this letter; the questions and assertions come off the top of my head, so there may be some errors, and most of the time I won't be telling you anything you don't already know.

First, let me consider the Flood via the Bible. Genesis does not say explicitly that the Flood was both global and cataclysmic, yet it strongly implies that such was the case. The statement, "the floodgates of heaven were opened" does not seem to describe a mere heavy rain, but rather a torrential downpour where one would think he was standing under a huge waterfall. All the water in the atmosphere today couldn't even start a flood like that described in the Bible. Besides, don't you think there is good reason to postulate the existence of a vapor or ice canopy that enveloped the planet before the Flood ("the waters above the firmament")? The resultant greenhouse effect would provide the vegetation for today's oil and coal deposits, and also provide a favorable environment for the dinosaurs and other large herbivores. The cataclysmic end of this protective canopy ("the floodgates of heaven were opened") could explain the sudden demise of the dinosaur, etc. Then there is the statement "the fountains of the deep burst open." This certainly sounds like the encroachment of the ocean in a cataclysmic way. Finally, the mountains being topped by the water would seem to indicate a planet-covering flood. The Bible says, "All the high mountains which were under all the heavens were covered."

Next, let me consider the "book of nature." It seems to me that it is here that we get the most convincing testimony of a global cataclysm. There are caves and crevices scattered about on the earth each abounding in fossilized animals of a wide variety from various climate zones, all thrown together in a chaotic state. There are huge tectonic uplifts with fossils of "highly evolved" marine life in the uppermost regions. There are the instantaneously frozen mammoths of Siberia, the flesh of which when discovered was fresh enough to be eaten by dogs, and whose stomachs contained plants from a temperate climate zone. Finally, there are the deposits of coal and oil which are so immense as to boggle the mind that are deep under sedimentary rock and are under great pressure…


Ken Wilson
Baltimore, MD


Dear Ken,

Since receiving your letter, several more issues of The Biblical Chronologist have been mailed, so you are now better acquainted with what the scientific data related to the Flood which I have been studying are revealing about that event. Specifically, we both agree that the Flood was a global event, so that matter needs no further discussion here. It is only the geologic potency of the Flood which is in question.

I suggest we are also in rough agreement regarding the relation of the cataclysmic Flood model to the Bible. The main point I tried to make in the introduction to my article on Elk Lake was that the claim that the Bible teaches the Flood was cataclysmic is false. I made this point by arguing: 1. that mention of the sorts of phenomena which would characterize such a cataclysm (earthquakes, volcanoes, tidal waves, etc.) is conspicuously absent from the Genesis account of the Flood; 2. that the phrase "floodgates of the sky" was clearly metaphorical, and the parallel phrase "fountains of the great deep" should therefore also be understood as a metaphore—these can not legitimately stand as proof of a cataclysmic Flood; and 3. that the only way the cataclysmic Flood model can be attached to the Bible is through a fallible and potentially incorrect process of human inference.

You state that "Genesis does not say explicitly that the Flood was … cataclysmic". So I think we are in essential agreement on points 1 and 3 above. And I am not sure we are too far apart on point 2. When you state that the phrase "floodgates of the sky" means "a torrential downpour" you are interpreting the phrase metaphorically—you are not suggesting we should look for literal dams in the sky.

I conclude that we differ, in fact, only over the science issues, not the Bible issues. You may find this surprising, since the introductory statement in your second paragraph claims that the Bible strongly implies the Flood was cataclysmic, which claim I certainly disagree with. But I would suggest that you have presented no argument in your letter to substantiate this claim.

If you dissect your second paragraph, which explains why you think the Bible implies the Flood was cataclysmic, you will find that you are mainly discussing scientific notions which you have attached to the Bible rather than what the Bible in and of itself says or implies. You mention vapor and ice canopies (which the Bible nowhere explicitly mentions), the water-holding capacity of today's atmosphere (which the Bible does not discuss), the greenhouse effect (also not mentioned in the Bible), the origin of oil and coal (similar fate), and the extinction of the dinosaurs (also not discussed in the pages of Scripture). Having read your second paragraph I am still left with the question, "But where does the Bible strongly imply that the Flood was a cataclysm?"

The metaphorical expression, "the floodgates of heaven were opened", which you mention, may imply a torrential downpour as you suggest, but a torrential downpour is not a globe-shattering cataclysm. The metaphorical expression, "the fountains of the great deep burst open" may imply encroachment of the oceans over the land, but that is a far cry from tidal waves and earthquakes and volcanoes and mid-oceanic rifts opening up and ocean floor sinking into the mantle of the earth and the surface of the earth being torn up and redeposited as mile-deep sediments all over the globe. I repeat: "Where does the Bible strongly imply that the Flood was a cataclysm?"

I suggest that once you have properly separated what the text of Scripture actually says from the strictly scientific notions you have been taught to import into your reading of Scripture you will find that we are actually in agreement regarding the relation of the cataclysmic Flood model to the Bible. So it is only the science which is at issue.

You are correct that I am well familiar with the scientific claims you have advanced in your letter. They can be found everywhere in modern creation/science literature of the sort which is intended for non-specialist audiences. As a former employee of The Institute for Creation Research in San Diego (I taught Physics in the ICR graduate school for eight years) I have had opportunity to examine some of the current "lay" creationist literature close up, and I am afraid that I cannot advise putting much faith in much of it.

I am hardly the first or the only one to have made this observation. For example, a scientist friend, much my senior, and devoted to and active in the creation/science movement for many years (now retired) observed in a letter to me in December 1991:

There is much creationist literature that is highly regarded by [lay] individuals, but which only brings Biblical creationism into disrepute among scientifically competent individuals who do not share the theological commitment this literature attempts to serve.

I urge you to check out the well-known "facts" you are using to formulate your model of the Flood. For example, are you sure the mammoths of Siberia were "instantaneously frozen"? Do you know of any tests which were run to determine just how quickly they were frozen? Did you see the results of these tests yourself, in some first-hand science publication? Are you quite sure the "stomachs contained plants from a temperate climate zone"? Can you back this claim with a science publication by an individual who examined the stomach contents and had sufficient training to know what he was looking at? Similar questions apply to your other assertions.

I do not mean to put any blame on you for these assertions. You have, in the first place, plainly stated that these "assertions come off the top of [your] head, so there may be some errors". And, in the second place, you have not invented these ideas; you are merely repeating what you have been told by others. But just as you would be well-advised to inspect the foundation of a home you were considering purchasing, I am advising you to take a critical look at the foundational "facts" you are building your view of the Flood upon. I think you will be surprised to find how little confidence most of them actually warrant.

But I do not wish to dwell on this unhappy topic. There is another unhappy topic, much more germane to the purpose of this newsletter, which I must move to in closing.

There are times when a teacher feels somewhat of a failure, and your letter has definitely had that kind of impact on me.

I have spent a good deal of time and effort in this newsletter explaining why it is important to put chronology first if one wishes to discover the truth about history. I have tried to stress this because it is an essential. But I have apparently failed to get the point across.

Please note that you have lumped the formation of fossils, the origin of tectonic uplifts, the freezing of mammoths, the formation of coal and oil, and even the extinction of the dinosaurs all together into the brief year of the Flood. I am happy to think with you along such lines—no hypothesis is too far-fetched to be worthy of sober consideration, in my opinion. But I must insist on one thing. I must insist that we abide by Rule #1.[11] I must insist that chronology must precede history.

Where is your chronological data? Where is the physical chronological evidence that all of these things happened 5,500 years ago? Indeed, where is the chronological evidence that they even all happened at the same time?

Please show me that evidence first. If it stands up to rigorous analysis, then we can move on to the implications of all these things for the Flood. Otherwise I must conclude (and so should you) that there is no logical reason to suppose they have anything at all to do with the Flood, or even with one another, no matter how compelling the story which one may compose with them may seem to be.


Gerald E. Aardsma, Ph.D.
Loda, IL

Research in Progress

Where did the water which covered "all of the high mountains everywhere under the heavens" during the Flood come from?

I have read or heard, at one time or another, a number of different ideas designed to answer this question in whole or in part. For example, some have proposed that ice rings, similar to those which orbit Saturn at present, once orbited Earth and that these collapsed at the time of the Flood. Others have suggested that Earth's atmosphere once supported a thick, global blanket of water vapor which condensed and rained down at this time. Others have postulated that great underground reservoirs of water burst open at the start of the Flood and discharged their contents onto the surface of the globe. Still others have proposed that the principle sources—and sinks—of the Flood waters were the world oceans.

Most of the ideas mentioned above exhibit serious difficulties of one sort or another when analyzed quantitatively using known physical laws. But the fact is that an entirely satisfactory scientific explanation of the rise of the Flood waters and their eventual retreat has yet to be found. So for the present investigation I will ignore the relative merits or otherwise of these ideas and treat each as a viable possibility. The thrust of the present article is simply to point out that radiocarbon has something to say about this question, and to show what it is that radiocarbon says.

Last issue I used the first nine radiocarbon measurements shown in Table 1 to determine the fraction of annual sedimentary layers which have gone uncounted in laminated sediment cores taken from Elk Lake in Minnesota. I found that 17% of the annual layers were missing from the Elk Lake layer counting chronology on average.[12] When the layer counting chronology was corrected by the restoration of these missed layers, the Flood was found to coincide with the end of an anomalous interval of 600 layers in the Elk Lake core. Examination of these 600 layers led to the hypothesis that they did not represent 600 annual layers, but rather that they had all been deposited in a short space of time as a result of Noah's Flood.

Table 1: Uncalibrated radiocarbon dates on samples from Elk Lake.

The tenth radiocarbon measurement in Table 1 is for a sample taken from layer 5084, roughly in the middle of the Flood deposit.

Working within the pelagic Flood model (recall: "pelagic" means "like the open ocean"), the 600 layers which constitute the Flood deposit are known from Biblical chronology to all date to 3520±21 B.C.[13] The radiocarbon age of a sample taken from these layers will contain two components: the actual age of the sample, and the old carbon contribution.[14] The old carbon contribution to the radiocarbon age of these layers is the quantity of interest in the present investigation. It has potential for telling us something about where the column of water which existed above Elk Lake during Noah's Flood came from.

Rain water which is collected directly from the sky will contain a small amount of carbon dioxide as carbonic acid. The carbon involved here is derived from the atmosphere and will contain no old carbon. Consequently, organisms grown in fresh rain water will have no old carbon contribution to their radiocarbon age. If the Flood waters at Elk Lake all came from fresh rain, either through the melting of ice rings or the condensation of a vapor canopy or from any other source, then the old carbon contribution to radiocarbon ages in the lake at the time of the Flood would be expected to be significantly reduced relative to its present value of 600 radiocarbon years.[15]

If rain water comes in contact with limestone, it can pick up old carbon atoms from the limestone. Organisms grown in rain water which has percolated through limestone can have an old carbon contribution to their radiocarbon age of hundreds of years. This, in fact, is the situation which prevails at Elk Lake today. If the column of water which existed above Elk Lake at the time of the Flood contained mostly rain water which had been in substantial contact with limestone or other sedimentary sources of old carbon, then an old carbon contribution to the radiocarbon age approaching that of the modern lake might be expected.

Underground reservoirs of water are more difficult to analyze because their physical circulation is not clear. If they were sealed off from the atmosphere they would be expected to contain essentially no radiocarbon and thus they would be expected to exhibit a very great old carbon effect, probably in excess of forty thousand years. If, on the other hand, they mixed with surface waters, then they would be in much the same class as modern lakes, and an old carbon contribution on the order of centuries might be expected.

A different prospect presents itself if the water above Elk Lake at the time of the Flood was principally from Earth's oceans. Modern samples grown in equilibrium with surface ocean water have yielded radiocarbon ages from essentially zero to as much as 885 radiocarbon years, depending upon the geographical location from which the samples were taken.[16] But the surface waters of the oceans constitute only a small fraction of the total volume of water residing in the oceans today. Most ocean water resides in the deep ocean.

The Geochemical Ocean Sections Study program (GEOSECS) measured radiocarbon concentrations at all depths in the world oceans and found that: "The average 14C/12C ratio for the ocean is about 15% depleted with respect to the preindustrial atmosphere".[17] This average radiocarbon concentration converts to an average radiocarbon age for the oceans of about 1300 radiocarbon years. Organisms (e.g., fish, diatoms, clams) growing in average ocean water inherit the radiocarbon age of their environment; they will have a radiocarbon age of 1300 radiocarbon years even while they are living. (Thus, to get the true calendar age of a sample grown in average ocean water one would need to subtract 1300 years from the measured radiocarbon age.) If Elk Lake were covered by average ocean water (i.e., water which came from the deep ocean) at the time of the Flood, then the radiocarbon age of samples from the Flood layer would be expected to show an old carbon contribution on the order of a millennium.

Result

Line 10 of Table 1 contains the radiocarbon measurement on the Flood layer at Elk Lake. The measured radiocarbon age of this portion of the layer is 5,750±120 radiocarbon years. A terrestrial sample grown in equilibrium with atmospheric carbon dioxide in 3520 B.C. (i.e., at the time of the Flood) will currently have a radiocarbon age of 4,744±22 radiocarbon years.[18] Thus the apparent "old carbon" contribution for sample 10 of Table 1 is (5,750±120 - 4,744±22 = ) 1,006±122 radiocarbon years.

One must be careful here. Experience has shown that it is not wise to base too much on a lone radiocarbon measurement. Things can go wrong during collecting, preparing or measuring a sample. One would like to see this measurement independently duplicated or triplicated before too much is made of it. Nonetheless, the following two points seem appropriate at this stage.

First, this single measurement is supportive of the pelagic Flood model, which pictures Noah's Flood as characterized, not by catastrophe and overwhelming upheaval of the crust of the earth, but simply by all lands being submerged beneath water, as if the world were covered everywhere by a single world ocean. Furthermore, this measurement is harmonious, not with the notion that some of the surface water of the oceans spilled out over the land, but with the idea that the continents were buried for a period of time by water which had actually come from the deep ocean basins.

Second, this model leads to the suggestion that the apparent inversion of radiocarbon ages between samples 11 and 10 in Table 1 (i.e., sample 10 appears older than the more deeply buried sample 11) is real rather than due to some measurement error. This apparent age inversion is explained by the sudden presence of radiocarbon-deficient deep ocean water at Elk Lake during the year of the Flood. The pelagic Flood model predicts that a more detailed set of radiocarbon measurements on the Elk Lake cores in the region of the 600 anomalous layers (i.e., the Flood deposit) would reveal a rather sudden transition to markedly older radiocarbon ages at the boundary into the 600 layer interval, and roughly constant radiocarbon ages throughout the interval.

This radiocarbon age-inversion signal, if corroborated at Elk Lake, could be very helpful in identifying the Flood in many other lake environments. The sediments on the bottom of most lakes are not laminated the way the Elk Lake sediments are. The laminations at Elk Lake appear to be a consequence of the great depth of the lake relative to its surface area. This, apparently, has kept the deepest portions of the lake from being sufficiently oxygenated to support macroscopic life. And this has prevented organisms from burrowing in the deep lake sediments, protecting these sediments from biological homogenization. It appears that these special conditions have not existed in most lakes—their sediments are usually found to be homogenized. In the absence of annual layering, this radiocarbon age-inversion signal may be the only way of detecting the Flood in most lake sediments from around the world. ◇

The Biblical Chronologist is a bimonthly subscription newsletter about Biblical chronology. It is written and edited by Gerald E. Aardsma, a Ph.D. scientist (nuclear physics) with special background in radioisotopic dating methods such as radiocarbon. The Biblical Chronologist has a threefold purpose:

  1. to encourage, enrich, and strengthen the faith of conservative Christians through instruction in Biblical chronology,

  2. to foster informed, up-to-date, scholarly research in this vital field within the conservative Christian community, and

  3. to communicate current developments and discoveries in Biblical chronology in an easily understood manner.

An introductory packet containing three sample issues and a subscription order form is available for $9.95 US regardless of destination address. Send check or money order in US funds and request the "Intro Pack."

The Biblical Chronologist (ISSN 1081-762X) is published six times a year by Aardsma Research & Publishing, 412 N Mulberry, Loda, IL 60948-9651.

Copyright © 1997 by Aardsma Research & Publishing. Photocopying or reproduction strictly prohibited without written permission from the publisher.

Footnotes

  1. ^  Gerald E. Aardsma, A New Approach to the Chronology of Biblical History from Abraham to Samuel, 2nd ed. (Loda IL: Aardsma Research and Publishing, 1993).

  2. ^  Genesis 1:14. Notice that the moon plays only a minimal time-keeping role in Western calendrical practices today (associated with the timing of religious holidays), in sharp contrast to the prominent role it played in many ancient calendar systems.

  3. ^  To see this, multiply the average synodic month of 29.530588 days by twelve to count the days from the beginning of the seventeenth day of the second month of Noah's six hundredth year to the beginning of the seventeenth day of the second month of Noah's six hundred and first year, then add eleven days to go from that point to the end of the twenty-seventh day. The result is 29.530588×12 + 11 = 365.367056 days.

    I was introduced to this interesting fact several decades ago by a little tract called Discovering the Calendar of the Creation. [William G. Lowe, Discovering the Calendar of the Creation (Narrowsburg, New York: Scripture Truth, 1971).]

  4. ^  Gerald E. Aardsma, "Chronology of the Bible: 5000–3000 B.C.," The Biblical Chronologist 2.4 (July/August 1996): 3.

  5. ^  The quoted uncertainties on these two dates are understood to be correlated rather than independent. The fundamental Biblical datum is that the Flood lasted one year, so the dates of commencement and termination of the Flood must always differ by one year only.

  6. ^  Gerald E. Aardsma, "Noah's Flood at Elk Lake," The Biblical Chronologist 2.6 (November/December 1996): 1–13.

  7. ^  Simple chronological considerations show that the Greenland ice sheet definitely existed before the Flood. This conclusion, in turn, falsifies the postulate that the pre-Flood climate was globally warm.

  8. ^  Jack Finegan, Handbook of Biblical Chronology (Princeton: Princeton University Press, 1964), 32.

  9. ^  It should be pointed out that this month length pattern may eventually help to pinpoint the exact year and even the exact day relative to the Gregorian calendar when the events recorded in Genesis 7 and 8 took place. I say "may" for several reasons, not the least of which is the Biblical indication of possible Divine tampering with the "hands" of the astronomical clock during Joshua's long day (Joshua 10:12,13) and Hezekiah's sign (2 Kings 20:8–11).

  10. ^  Genesis 8:22; NASB.

  11. ^  Gerald E. Aardsma, "Biblical Chronology 101," The Biblical Chronologist 2.3 (May/June 1996): 10.

  12. ^  Gerald E. Aardsma, "Noah's Flood at Elk Lake," The Biblical Chronologist 2.6 (November/December 1996): 1–13. Note that the "33" in Equation (2) and subsequent text on page 12 of original issues should be corrected to "23". This has now been corrected in the master, so those who have obtained Volume 2, Number 6 as a back-issue will find "23" already. Note also that a paper which I submitted to Radiocarbon dealing exclusively with radiocarbon's implications for missing annual layers in the Elk Lake chronology has been reviewed and accepted for publication. This substantiates the method of analysis used to establish the missing annual layers. The change of the "33" to "23" in Equation (2) [first pointed out by Tom Godfrey, a BC subscriber] occasioned a careful review of the entire calculation and simultaneously a more detailed analysis. The only impact of this was to increase the fraction of missing layers from 17.0% to 17.6%. This rounds to 18%, which is how it appears in the paper accepted for publication by Radiocarbon.

  13. ^  Gerald E. Aardsma, "Chronology of the Bible: 5000–3000 B.C.," The Biblical Chronologist 2.4 (July/August 1996): 2–3.

  14. ^  See last issue for a discussion of the old carbon contribution to the radiocarbon age of samples from lake environments.

  15. ^  Gerald E. Aardsma, "Noah's Flood at Elk Lake, Technical Appendix," The Biblical Chronologist 2.6 (November/December 1996): 13.

  16. ^  Minze Stuiver and Thomas F. Braziunas, "Modeling atmospheric 14C influences and 14C ages of marine samples to 10,000 BC," Radiocarbon, 35.1 (1993): 156 (Fig. 16).

  17. ^  J. R. Toggweiler, K. Dixon, and K. Bryan, "Simulations of Radiocarbon in a Coarse-Resolution World Ocean Model: 1. Steady State Prebomb Distributions," Journal of Geophysical Research 94.C6 (1989): 8221.

  18. ^  Minze Stuiver and Bernd Becker, "High-precision decadal calibration of the radiocarbon time scale, AD 1950–6000 BC," Radiocarbon, 35.1 (1993): 57–65.


Volume 3, Number 2March/April 1997

The Ark on Ararat?

Did Noah's ark come to rest on Mount Ararat?

Before delving into this question it is perhaps important to address another question: "What difference does it make to Biblical chronology where the ark landed?"

Actually, it makes quite a bit of difference at the present time.

Biblical chronology research over the past several years has repeatedly indicated that 3520±21 B.C. is the proper date for Noah's Flood. This is the date one calculates for the Flood from the Bible when allowance is made for an accidentally dropped "one thousand" years from the text of extant Old Testament manuscripts of 1 Kings 6:1.[1] The evidence from Biblical archaeology and secular history is such that sane reasoning can only conclude that this "one thousand" has indeed been dropped. When no allowance is made for it, archaeological data are severely at odds with the Biblical narrative prior to the time of King David, and sacred and secular histories of all earlier periods prove irreconcilable. In sharp contrast, when allowance is made for this "one thousand" Biblical history immediately harmonizes with archaeology and secular history—as practically every issue of The Biblical Chronologist has shown.

I have previously shown that this is also the case with the Flood. While dates for the Flood in the third millennium B.C. (what one gets if the missing "one thousand" is ignored) range from preposterous to impossible when assessed relative to available archaeological data, 3520±21 B.C. (what one gets if the missing "one thousand" is taken into account) works out very well. Most importantly, it coincides with the sudden disappearance of Chalcolithic peoples in Palestine and elsewhere in the Middle East.[2]

Please note that evidence for an abrupt termination of human civilization is the most fundamental requirement of the Biblical account of the Flood. That, after all, the Bible informs us, is what the Flood was fundamentally about. If no secular evidence of such a termination could be found near 3520 B.C. then either this Biblical date, or the historicity of the Biblical Flood account would necessarily be called into serious question.

But no such problem arises. Biblical archaeology immediately reveals a widespread discontinuity in human civilization within dating uncertainties of 3520 B.C.—in sharp contrast to the obvious continuity of civilization from that time to the present.

In addition, Biblical archaeology and secular history reveal that it is only subsequent to this date that political units such as kingdoms and city-states begin to be seen. This is of considerable significance. The Bible places the origin of human government in a Divine decree given to Noah following the Flood.[3] Thus, the Bible leads us to expect that human government will be a part of human societies only following the Flood. Kingdoms and city-states are very clear manifestations of human government. Their total absence before 3500 B.C., and ubiquitous presence by 3000 B.C. strongly support the 3520 B.C. date for the Flood and argue against the idea that the Flood should be dated to any other millennium.

Clearly, as far as archaeology and secular history are concerned, there are some solid reasons for accepting a date for the Flood near 3500 B.C.

But there is another requirement of a fundamental sort, in addition to an abrupt termination of human civilization and the origin of human government, which the Biblical account of the Flood places on any proposed date for the Flood. This requirement does not fall within the scope of archaeology, but rather geology.

Geology and the Flood

The Bible is quite clear that the Flood achieved great depth, so that mountains were covered.[4] The Bible is also quite clear that the Flood lasted for the better part of a year.[5] It is impossible, in the real world, to cover mountains with water for a number of months and leave no detectable trace that such a thing has happened. Stated simply, if Noah's Flood happened 3520±21 B.C., then geological evidence of such an event at this date should be forthcoming.

Now let me digress briefly. One does not have to read very much in the history of the science of geology to know that this problem—the geologic evidence for Noah's Flood—was of very great interest and concern to geological scholars a century or two ago. And one does not have to read very far in the modern geological literature—any college textbook will do—to see that Noah's Flood is of no interest at all to the modern discipline. It is thus a fact that, despite considerable effort, leading geologists failed to find a place for the Flood within their scientifically rigorous discipline.

Now the impact of Noah's Flood on the history of geology is of academic interest only. But not so the impact of the science of geology on mankind's perception of Noah's Flood. Geology's sustained failure to find any effects which might reasonably be ascribed to the Flood has seemed to falsify the Genesis account of that event. Since one cannot hope to convict the Bible of falsehood in matters of mundane history and simultaneously sustain any intelligent confidence in it as a divinely inspired holy book, it is hardly surprising that many have traced the now advanced secularization of Western civilization to this geological failure.

I mention this merely to point out that here again the humble and, these days, generally overlooked discipline of Biblical chronology seems to be at the root of much bigger things. Clearly, geological confirmation of the new Biblical date for Noah's Flood has implications well beyond the boundaries of the discipline of Biblical chronology.

But let me return to the main point. The direction of Biblical chronology research over the past several years leads us to expect geological confirmation of Noah's Flood within secular dating uncertainties of 3520±21 B.C.

I have recently shown what I believe to be the first such evidence. Specifically, laminated sediments from Elk Lake in Minnesota show a very thick and otherwise anomalous layer in coincidence with this date.[6]

This discovery leads immediately to the question, "Can the Elk Lake evidence for a global Flood at about 3500 B.C. be corroborated in other natural reservoirs of chronologically well-controlled data?" Ability to answer this question in the affirmative will satisfy the geological requirement for this date—showing that the Elk Lake evidence does not arise by mere chance or coincidence—and place this date for the Flood on a very firm footing.

Graphing the Depth of the Flood

To aid in answering this question I set about, several months ago, to construct a graph of the depth of the Flood versus time. Such a graph would help to determine much about the potential impact of the Flood in various geological reservoirs. It would assist in deciding where to look for further geological evidence of the Flood, and it would assist in correctly interpreting whatever evidence might be found in such reservoirs.

It was clear from the start that such a graph could only be gotten, if at all, from the Genesis narrative of the Flood.

When I turned to Genesis I quickly found that it does provide some potentially important depth of water versus time data, but I also quickly found that one must possess an accurate knowledge of where the ark came to rest for these Biblical data to be of much value.

For example, the Biblical narrative indicates that the ark came to rest on a mountain on the 150th day after the commencement of the Flood. If we knew which mountain this was, then the present height of that mountain should provide a very good estimate of the depth of the Flood on Day 150 of the Flood. As a further example, the Genesis narrative informs us that the tops of neighboring mountains became visible on Day 222 of the Flood. Once again, if the mountain the ark landed on could be determined, then the measured heights of the neighboring mountains today would provide us with a fair estimate of the depth of the Flood on Day 222.

Thus, if the mountain Noah's ark came to rest upon could be accurately determined it would help us to know how deep the water was at various stages of the Flood. This in turn would help us to know where to look and what to look for as we search for additional geological evidences of Noah's Flood at about 3500 B.C. And discovery of such evidences would confirm the new Biblical date for the Flood of 3520±21 B.C., a vital step in current Biblical chronology research.

Tradition

Tradition says the ark landed on Mount Ararat, the tallest peak in modern Turkey (Figure 1).

Figure 1: Map of Ararat region and its surroundings. The area bounded by the longitudes and latitudes shown was included in the present investigation. Dashed lines follow borders of modern countries.

But tradition has not proved to be an always reliable guide to ancient Biblical sites. I have previously argued, for example, that it has clearly misidentified the site of the Biblical Mount Sinai.[7] Furthermore, numerous expeditions to Mount Ararat to search for remains of the ark have so far failed to come up with anything convincing—despite some claims to the contrary.[8] For the present purpose one needs something more substantial than tradition to go on.

Bible

It is commonly believed that the Bible tells us directly that the ark landed on Mount Ararat. In point of fact, however, it does not do so.

In Genesis 8:4 the Bible records that "the ark rested upon the mountains of Ararat". Bible scholars observe that the use of the plural—mountains—precludes the identification of any particular mountain by the Bible writer.[9] Rather, they suggest, "the mountains of Ararat" should be understood as referring to a mountainous area in a region known as Ararat. Correct interpretation of Genesis 8:4 seems to demand we accept that the Bible is not referring to a specific mountain, but rather to a geographical region when it mentions the resting place of the ark.

The Location of Ararat

Where is this region called Ararat to be found on the globe? If the Bible does not tell us directly which mountain the ark landed on, might it nonetheless help us locate the general area in which the ark came to rest?

"Ararat" is mentioned three times in the Old Testament in addition to Genesis 8:4. Unfortunately, these references are not very helpful in and of themselves when it comes to the problem of locating this region. The first two are parallel accounts in 2 Kings 19:37 and Isaiah 37:38 which mention "the land of Ararat" but do not tell us where that land is. The third (Jeremiah 51:27) is a prophecy against Babylon which mentions the "kingdoms of Ararat, Minni and Ashkenaz". Here again no specific geographical details are provided.

Apparently, no direct indication of the location of the Ararat region is to be found in the Bible. But these Bible references do increase our knowledge of the meaning of the word "Ararat" as it is used in the Bible. They show that "Ararat" is indeed a reference to a region (a "land") rather than a specific mountain. They also show that, at least during the time of Jeremiah (approximately 600 B.C.), a kingdom of Ararat was known. And Genesis 8:4 adds to this the expectation that the Ararat region contained a mountainous area.

Genesis 11:2 provides some important indirect Biblical evidence regarding the location of Ararat. It informs us that the descendants of Noah came into the land of Shinar (which we understand to be the plain between the Tigris and Euphrates rivers in Mesopotamia) "as they journeyed east". This would place the region of Ararat to the west of Shinar. Unfortunately, this geographical hint is complicated by the Septuagint rendering of this verse which reads "as they moved from the east". This would put Ararat in the opposite direction, to the east of Shinar.

It seems necessary to conclude that the location of the Ararat region cannot be ascertained with any certainty from the Bible alone.

Biblical Archaeology

The most direct link to the location of the Ararat region seems to come about through a combination of Biblical and archaeological data. Specifically, an independent kingdom known to the Assyrians as Urartu was familiar to the Assyrians as a neighbor and enemy from about 850 B.C. Urartu is known from archaeological and historical data to have been located in the vicinity of Lake Van in modern Turkey (Figure 1).

The kingdom of Urartu seems to be the only possible candidate for the kingdom of Ararat which Jeremiah mentions. In addition to this archaeological lead it should be noted that the geographical region associated with Urartu encompasses the traditional Mount Ararat. This tells us that Christians, for many centuries at least, have, for whatever reasons, held this to be the Ararat region. Furthermore, this region seems to best satisfy the Biblical evidence. It contains many mountains. It is also the region from which the Tigris river begins, making it easy to see how Noah's descendants could have come upon the land of Shinar by following the southeastward course of this river.

Scholarly Consensus

By taking these Biblical and archaeological facts into consideration, scholars seem to have come more or less unanimously to the conclusion that the Ararat region corresponds roughly to eastern Turkey today:

A country in the region of Lake Van in Armenia, where today the borders of Russia, Iran, and Turkey converge.[10]

A country in [the historical] Armenia, its center being Lake Van.[11]

The name Ararat, as it appears in the Bible, is the Hebrew equivalent of Urardhu, or Urartu, the Assyro-Babylonian name of a kingdom that flourished between the Aras and the Upper Tigris rivers from the 9th to the 7th century BC.[12]

Spreading northwestward [from the region of Lake Van] into Transcaucasia, Urartu extended its settlements to the region of Mount Ararat, the valley of Araxes (modern Aras), and Lake Sevan, and westward, for a time, as far as Melitene (modern Malatya).[13]

The general region indicated by these scholars is shown in the map of Figure 1. The area bounded by longitudes 37°E on the west and 48°E on the east, and latitudes 36°N on the south and 42°N on the north includes Lake Van, Malatya, Lake Sevan, and all of the other landmarks mentioned in the preceding quotes. It seems certain that Noah's ark came to rest somewhere within this bounded area.

Narrowing the Search

This is a large region. Can we narrow the resting place of the ark any further? Careful attention to the Biblical narrative does permit us to do so.

Most importantly, notice that the Biblical text demands the idea that the ark came to rest on a mountain. We cannot suppose that the ark rested somewhere in an open plain because Genesis 8:4 states plainly that "the ark rested upon the mountains of Ararat". The broad setting is clearly mountains, not plain. But we also cannot suppose that the ark came to rest in some valley in the mountains. The Biblical narrative informs us that 72 days elapsed after the ark had come to rest before the tops of neighboring mountains became visible. If the ark had landed in a valley between mountains, the mountains would have been visible long before the ark ever grounded. It is clear that the ark must have come to rest upon a mountain.

Finding the Mountain

This narrows the search considerably, but not nearly enough. Ararat is a very mountainous region and the bounded area of Figure 1 contains hundreds of mountains. Is there any way of narrowing the search any further?

I worked on this problem for several weeks. I do not mean to imply that it was an especially difficult problem. It was simply a big project—much bigger than I had anticipated—because of the large number of mountains involved. I proceeded as follows.

Initial Analysis

The basis of my analysis was Genesis 8:5,

And the water decreased steadily until the tenth month; in the tenth month, on the first day of the month, the tops of the mountains became visible. (NASB)
This is the first mention of visible land following the commencement of the Flood. I believe it contains several clues to the location from which Noah made this observation.

First, notice that this first mention of visible land is not of the mountain which the ark came to rest upon. I suppose one might argue that Noah simply failed to mention the first sighting of the mountain the ark landed on, but this seems highly unlikely. Noah and his family had watched the waters of the Flood swallow the land—their homeland. Subsequently they had drifted upon a boundless and seemingly relentless ocean for many months. We saw last issue how Noah used the metaphor of a titanic struggle between water and earth to describe the Flood. Surely the first appearance of land as the Flood began to wane must have been a sight of great significance to those aboard the ark. It seems inevitable that whatever land was first seen was bound to be recorded by Noah.

So the fact that the first land Noah reports seeing is the neighboring mountains implies that he had not seen the mountain the ark had come to rest upon by the time the ark grounded, or even by the time the neighboring mountains emerged from the water 72 days later.

This is a very important deduction relative to the present quest. It immediately suggests that the mountain the ark grounded on must still have been hidden beneath the water when the ark grounded upon it. If this were not the case then we would expect Noah to have seen the mountain as the ark drifted toward it. And in that case we would expect that sighting to have been the first land reported by Noah, rather than the sighting of the neighboring mountains.

But if the mountain was still hidden beneath the water when the ark grounded upon it then we must conclude that the ark came to rest at the summit rather than on the side of this mountain.

Thus Genesis 8:5 leads us to picture the ark as having come to rest at the summit of its mountain. When it first grounded, all that could be seen out to the horizon in all directions was water. As the water receded day after day the horizon would have moved further and further out away from the ark. Finally, after 72 days, Noah saw the tops of neighboring mountains poking through the surface of the water for the first time.

The most important clue to Noah's location to be found in this verse is that no neighboring mountains were visible when the ark grounded at the summit of its mountain. This would not be possible in the case of many mountains. If, for example, the ark had come to rest on a mountain having a near neighbor twice its height, then the near neighbor would have been sighted before the ark had come to rest, not 72 days after. Clearly, this clue can be used to eliminate many mountains in the Ararat region from further consideration as candidates for the mountain the ark landed on.

It might be thought that this idea, taken to its logical conclusion, leads immediately to the result that the ark must have landed on the highest mountain in the Ararat region. If it had landed on a shorter mountain, wouldn't the taller mountain already have been exposed above the surface of the Flood waters? In fact, because of the curvature of the surface of the spherical earth, it would have been possible for some mountains, which had already emerged from the Flood waters, to be hidden from Noah's view behind the horizon. (See Figure 2.) So Genesis 5:8 does not lead inevitably to the conclusion that the ark came to rest on the tallest mountain in the Ararat region. But the fact that it took 72 days for neighboring mountains to be exposed, during which time "the water decreased steadily", does suggest that the mountain the ark had landed on was the tallest one in its general vicinity.

Figure 2: Though mountain B is taller than mountain A it is hidden behind A's horizon. Nothing below the dashed line is visible from A past the horizon.

The Clue Applied

I applied this clue to the mountains of the Ararat region as follows.

I purchased five Tactical Pilotage Charts (TPCs) which together covered the area of interest to the present study.[14] These are topographical maps having a scale of 1:500,000. They are intended for aircraft pilots and are considerably more detailed and accurate than maps found in ordinary world atlases.

Uncertainties

I must pause and give a word of caution before proceeding. Even though these maps are very good, they are not perfect. In the present study we would have liked the heights of all mountain peaks to be known to better than ±50 feet (3σ). But these maps do not provide such high precision. It is a general rule-of-thumb in science that a 1% uncertainty is fairly good for most physical measurements. Many of the mountains in the Ararat region are over 10,000 feet high. It was no surprise, therefore, to find noted on the TPC maps that the standard uncertainty in elevations marked with a • on the maps "does not exceed 100 feet" while those marked with an × can have an uncertainty two or even three times as large.

But even if these maps could give elevations accurate to the nearest foot, we would still face some uncertainty with the present study. The fact is that mountains do change with time, and 5,500 years (back to the Flood) is a long time. For example, a mountain that erodes as little as one inch per year will have lost over 450 feet in 5,500 years. Furthermore, many of the mountains in the Ararat region—including Mount Ararat—are volcanic. There is no guarantee that none of these mountains have gained or lost substantial height through volcanic activity since the Flood.

Obviously, we must either be (intelligently) prepared to put up with these uncertainties, or forgo the present investigation altogether. But there is no reason to be timid, in my opinion. While it is clear from the outset that the final results of the present search cannot be guaranteed certain, the fact is that the mountains of Ararat have been measured to reasonable precision and it is reasonable to believe the topography of these mountains today mirrors the landscape Noah looked out upon from the ark 5500 years ago to a very large extent.

Additionally it is possible to minimize the impact of these uncertainties by adopting a probabilistic approach to the problem which considers multiple factors together. I have adopted such an approach in the current study.

But most importantly, please note that I am not attempting to prove anything here. I am, first of all, not attempting to prove that the Bible is true when it says the ark landed upon the mountains of Ararat. My confidence rests in the testimony of Scripture which states that the ark landed upon some mountain in the Ararat region—that matter requires no further proof as far as I am concerned. I am also not attempting to prove that the ark landed upon any given mountain in Ararat. Rather, I am only attempting to determine as scientifically as possible which of the many hundreds of mountains in the Ararat region seems at the present time to best satisfy the requirements of the Biblical narrative. For this purpose the TPC maps seem adequate, even if not entirely ideal.

On With the Search

Many spot elevations are given on the TPC maps. These are predominantly notations of the highest points—of obvious concern to pilots. Most simply note the heights of the peaks of mountains. A few, in low-lying areas, appear to give the elevations of small hills. Because we expect the mountain the ark rested on to be the tallest in its vicinity we expect the height of that mountain to be included among the spot elevations on these maps.

The first step in my search procedure was to test every mountain for which a spot elevation was given on these maps in the region of interest to the present study to see if any other mountain would be visible from it when it was barely covered by water. Because of the large number of mountains involved I found it necessary to use a computer to carry out this test. This meant that the positions (longitude and latitude) and heights (i.e., spot elevations) of the mountains shown on these maps needed to be entered into the computer. To avoid any subjective bias I decided to enter every spot elevation given on the maps within the chosen area of study, even those few which obviously only corresponded to low hills. I entered a total of 1,441 spot elevations with their corresponding position coordinates from the region of study.

As mentioned above, I chose as the region of study the area bounded by longitudes 37°E on the west and 48°E on the east, and latitudes 36°N on the south and 42°N on the north. (See Figure 1.) The extent of the studied region was deliberately chosen to exceed the extent of the Ararat region because candidate mountains within the Ararat region must still be tested against neighbors in areas adjacent to the Ararat region.

I next had to program the computer with the search criteria. This criteria was made suitably quantitative as follows.

The question of whether a neighbor mountain B will be visible from candidate mountain A when A is barely covered by water divides into several cases. If the elevation of B is less than A, then B will still be covered by water and will not be seen from A. If the elevation of B is greater than A then B will be out of water. It will be visible from A if it is close enough to A. It will be hidden behind the horizon if it is too far from A.

A little math quickly reveals that the critical distance, r, at which B will be barely visible from A is given by the equation:

In this equation e is the difference in height of the two mountains, A and B, and R is the mean radius of the earth, for which I have used the value 6,371 km. This equation shows, for example, that if B is 1 km higher than A then it will be visible from A when A is barely covered by water if the distance between A and B is less than 113 km.

I wrote a simple computer program which uses this equation to test each mountain in the region of study against all other mountains in the region of study to see which mountains would have no visible neighbors when barely covered by water. Of the 1,441 peaks entered, only 41 survived this test.

More Clues Applied

But 41 candidates is still 40 more than we would like. To reduce the number of candidates further I evaluated each of these 41 candidates in six categories.

My strategy at this point is perhaps best explained by an analogy. Imagine the police are looking for a certain criminal. They have rounded up 41 bad guys and are reasonably confident the man they are looking for is one of these 41. Unfortunately, the description of the criminal they have to go on is rather abbreviated, and worse still, they have been tipped off that the criminal may have had his appearance altered since the crime. Nonetheless, they determine to do the best they can using six characteristics of the criminal which they have deduced from the scene of the crime: his height was about 5 feet 7 inches; his hair was brown; he seems to have been muscular; …

The police detective ranks each bad guy in each of these six categories. For example, in the height category, the bad guy whose height is closest to 5 feet 7 inches is given a rank of 1. The bad guy whose height is next closest gets a rank of 2, and so on.

Clearly, if bad guy X is found to rank first in all six categories while the ranks of the other bad guys show no consistent behavior in the six categories, then the detective should choose X—he is an excellent match to the description.

But the detective doesn't need to have such clear-cut evidence to make a good choice. He can use the ranking he has done to evaluate the probability a given bad guy is the man he is looking for.

To carry out this probability test the detective converts the rank numbers to probabilities by simply dividing the ranks by the number of bad guys. For example, bad guy Y ranks 37 in the height category with a height of 5 feet 1 inch. From this the detective determines that the probability of one of these 41 bad guys having a height within 6 inches (i.e., 5 feet 7 inches minus 5 feet 1 inch) of the expected height of 5 feet 7 inches is 37/41.

The detective evaluates the relative probability of a given bad guy being the man he is looking for by multiplying the six probabilities for that bad guy together, one from each category. By doing so he is evaluating the total probability of that bad guy looking as similar as he does to the description of the criminal. A relatively high probability of looking that similar means lots of bad guys look that similar and this is probably not the bad guy he is looking for. A relatively low probability, however, means it is unlikely for a bad guy to look that similar to the description of the criminal, and in that case the degree of similarity may be more than just a coincidence.

If the detective finds that bad guy X has a total probability (after multiplication of the six probabilities) which is very much lower than the probability for the other 40 bad guys then he has objective grounds for once again choosing X. X is then, by far, the most likely of the lot.

Note, however, that the detective will not be able to make a choice if two or more bad guys share nearly identical lowest probabilities. This would mean they were equally similar to the description. (Perhaps the criminal has a twin brother, also pursuing a career in crime!) If none of the bad guys has a probability much lower than any of the others the test fails altogether and the detective is back to the drawing board. This would perhaps suggest that the criminal did a truly remarkable job of altering his appearance before the test was conducted.

Now I will divulge the information that Mount Ararat is among the 41 candidates which we are about to examine by the procedure just described. But to protect the innocent (actually, to keep the discussion unprejudiced) I will forgo any further discussion of individual mountain identities until the completion of the examination. At this stage we are obviously interested in minimizing subjective bias and maximizing the degree of conformity of our test to the text of Scripture.

Category 1

I first looked at the distance from each candidate to the heart of the Ararat region around Lake Van. Some of the candidates were out near the border of the region of study, in areas which almost certainly were never part of the Ararat region—to the west of Malatya, in the plains of Syria to the south, and to the east of Lake Urmia, for example. Because of their location outside the Ararat region these obviously have very little likelihood of being the true mountain the ark rested on.

To proceed quantitatively I defined the "heart" of the Ararat region at longitude 43°E and latitude 38.667°N. This, according to the TPC maps, falls in the middle of Lake Van, around which, according to the quotes above, the kingdom of Ararat was centered. I then wrote another computer program to determine the distance between this point and each candidate mountain. The candidates were then ranked. The candidate which was closest to the heart of Ararat was assigned a rank of 1, and the one furthest from the heart of Ararat was assigned a rank of 41.

Category 2

I next computed a rank for each of the 41 candidates based on the height of the candidate relative to its first seen neighbor. The idea here is that Genesis records that 72 days elapsed between the grounding of the ark and the appearance of neighboring mountains. During these 72 days the "water decreased steadily". Meanwhile, in just 160 days from the time the ark came to rest the ground around the base of the mountain was observed by Noah to be dry. This would mean that the mountain the ark was on stood (160/(160-72)=) 1.8 times higher above its base than the height of the water when the first neighbor appeared if the water decreased at a constant rate. While it is unlikely the water decreased at a constant rate for this entire interval the indication still seems fairly strong that the mountain the ark came to rest upon was significantly taller than its neighbors.

I calculated the height of each of the 41 candidate mountains above its base and computed the ratio of this height to that of the height of the water above this same base when the first neighbor mountain was seen. I defined the base level as the height of the water at which roughly 90% of dry land today within a 50 mile radius of the candidate mountain would be above water back then. I obtained my estimate of this base level by visual inspection of the contours on the TPC maps around each candidate.

The candidate mountain having the highest ratio achieved the rank of 1; the candidate with the lowest ratio (equal, in fact, to 1) was ranked 41.

Category 3

For the third category I compared the water heights when the first two neighboring mountains became visible from each candidate. Genesis 8:5 reports neighboring "mountains" (plural) as the first visible land. This means that at least two mountains became visible during an interval of 24 hours.

To measure the relative conformity of each candidate to this Biblical requirement I computed the difference between the height of the water when the first neighbor was seen and the height of the water when the second neighbor was seen. I then divided this by the difference between the height of the candidate mountain and the height of the water when the first neighbor was seen.

For a constant rate of decrease in water height this ratio should be less than 1/72—1 being the maximum number of days allowed to expose the second neighbor after the first has become exposed, and 72 the number of days it took to expose the first neighbor from the time the ark grounded. The closer this ratio is to zero the more likely it is that the two neighbors would have been seen at the same time.

The candidate having the lowest ratio was assigned rank 1 in this category.

Category 4

In the fourth category I looked at the shape of the 41 candidate mountains. As noted above, Noah seems to have been unable to see the mountain the ark rested upon from inside the ark. This is presumably because his view much below the horizontal plain was restricted by the upper deck of the ark itself.

Such a restricted view is implied in several ways by the Flood narrative: the fact that Noah had to remove the covering of the ark to see that the ground was dry around the base of the mountain, and the fact that Noah had to send birds out from the ark to learn about his immediate environs, for example.

But we must couple this restricted view with the idea that the mountain the ark had landed on must have been somewhat conical and steeply sloped to fully explain Noah's actions and observations. Clearly, the narrower the top of the mountain we imagine the ark resting upon the more probable it becomes that Noah would have been unable to see it from inside the ark.

I calculated the ratio of the height of the candidate mountain exposed above water when the first neighbor became visible to the maximum width of the exposed portion of the mountain. The width was measured horizontally from the summit to the widest point on the exposed mountain. This widest point was estimated from the TPC maps. I used the closest contour to the height of the water wherever possible. With candidate mountains having a first-visible neighbor of nearly the same height, it was necessary to use the next lower contour to estimate the shape. In a few cases it was necessary to go down one or two contour increments (usually 500 or 1000 feet) on the mountain to reduce measurement error.

The candidate with the highest ratio of height to width received rank 1 in this category.

Category 5

Genesis 8:4 says "the ark rested in the mountains of Ararat". For Category 5 I ranked the 41 candidates according to how "in the mountains" they could be said to be.

When looked at on the TPC maps the Ararat region is seen to be made up of some large lakes, a significant proportion of high plateau, a few sizable valleys, and extensive foothills in addition to some large mountainous areas. Mountains are conspicuous on the TPC maps because elevations above 9,000 feet are colored differently than lower elevations and many of the mountains of Ararat exceed this elevation.

To estimate how "in the mountains" a candidate was I had the computer count the number of spot elevations greater than 9,000 feet within a 50 mile radius of the candidate. The candidate with the greatest number of such tall neighbors was given the rank of 1.

Category 6

I took my final clue from Genesis 11:2. It says of Noah's descendants, "And it came about as they journeyed east, that they found a plain in the land of Shinar and settled there" (NASB). This seems to imply that the discovery of Shinar by Noah's descendants was accidental rather than deliberate.

It seems probable that Noah's descendants would simply have followed the course of a river as they journeyed. This would ensure them adequate water while in the Ararat region, which receives only light seasonal rain today. As they moved further east and south it would have become increasingly mandatory to follow the river since it seldom rains at all in those regions.

The numerous mountain streams of the southern Ararat region generally find their way ultimately into the Tigris. It seems probable that Noah's descendants happened upon Shinar simply as a consequence of following some such stream to the Tigris and then following the Tigris to the east.

In any event, it seems reasonable to suppose that the closer the ark landed to the Tigris, and the further it landed down the Tigris toward Shinar, the more likely Noah's descendants would be of winding up in Shinar.

The Tigris leaves our designated area of study at longitude 43.33°E and 36.0°N. I had the computer rank the candidates according to their proximity to this point. The closest candidate was given the rank of 1.

Results and Discussion

Table 1 shows the ranking of each candidate in each category. The column on the far right shows the relative likelihood of the corresponding candidate being the mountain the ark landed on according to the six criteria outlined above.[15] These likelihoods are relative to Candidate 1 which is Mount Ararat.

Table 1: Ranks and relative likelihoods for the 41 candidate mountains in six categories.

It is apparent from Table 1 that the traditional claim that Mount Ararat is the resting place of the ark is not supported. There is another candidate—Candidate 18—which is considerably more likely to be the mountain the ark rested upon than Mount Ararat. According to this study Candidate 18 is 62.4 times more likely than Mount Ararat to be the mountain which corresponds to the Biblical narrative.

Candidate 18 is labeled "Cilo Dagi" on the maps; I will call it Mount Cilo. Its position is shown in Figure 1.

Table 1 shows that Mount Ararat (Candidate 1) and Mount Cilo (Candidate 18) both have high ranks in the first four categories. They are about the same distance from the center of Lake Van. They are both quite tall relative to their neighbors. They both have two first-visible neighbors of comparable height. And they are both steeply sloped. Notice, however, that Mount Cilo ranks higher than Mount Ararat in three of these four categories.

Though Mount Cilo is already more likely than Mount Ararat to be the mountain the ark landed on when just these first four categories are considered, it is the final two categories which separate them most distinctly. Mount Ararat ranks thirteenth for being "in the mountains" while Mount Cilo ranks third. A glance at the TPC maps confirms that this relative ranking is correct. Mount Ararat isn't really "in the mountains". A broad valley, associated with the Aras River, runs all along its northeast side, for example. This valley obtains a width of some 50 miles immediately to the north of Mount Ararat. An extension of this valley wraps around the base of Mount Ararat and its sister, Lesser Ararat, all along the south.

Mount Ararat and its sister are really somewhat isolated from other mountains. Mount Ararat is a very impressive mountain in photographs for just this reason. It is an enormous mountain, and it sits pretty much out in the open, dominating the view from the extensive valleys and plains at its base. But also, for just this reason, it is not really appropriate to say "the ark rested in the mountains of Ararat" if the ark grounded at the summit of Mount Ararat. It seems that a more accurate description in that case would be "the ark rested upon a mountain in Ararat". The setting of Mount Ararat doesn't seem to match the Biblical description very well—which is why its rank is only 13 in this category.

By way of contrast Mount Cilo really is "in the mountains". It is in the middle of a very mountainous area, and many of the mountains which surround it are over 10,000 feet high. Its high rank of 3 clearly reflects the good match between Mount Cilo's setting and the Biblical description.

Mount Ararat is also located much further from the Tigris than Mount Cilo. If one follows any stream from the base of Mount Ararat they will come to the Aras River. If they follow the Aras River they will come eventually to the Caspian Sea. There is no obvious reason why one would come upon the land of Shinar starting from Mount Ararat.

In contrast once again, every stream which flows from the base of Mount Cilo leads ultimately to the Tigris and to the land of Shinar.

Conclusion

Does this mean that Mount Cilo was the mountain the ark rested upon? Probably. A factor of 62 in likelihood is difficult to explain otherwise. Why else should this previously unknown and unsung mountain match the Biblical narrative so much better than any of its 1,440 competitors?

If we bar Mount Cilo from the competition, then Mount Ararat becomes the winner. But notice that Mount Ararat is only about twice as likely as Candidate 16, the next most likely mountain. The slight difference between these two candidates contrasts sharply with the factor of 62 which separates Mount Cilo from Mount Ararat. The numbers say that Mount Cilo is an excellent match to the Biblical description and that no compelling alternate candidate exists.

If Mount Cilo is the mountain the ark rested upon, then it is immediately clear why the numerous expeditions to Mount Ararat have never turned up any evidence of the ark ever having been there. I am caused to wonder, of course, whether the ark might possibly be discovered one day on Mount Cilo?

But rather than speculate on such lofty questions, let me emphasize what is now perfectly clear. If we are to place the determination of the depth of the Flood on a scientifically defensible basis then we must reject the traditional Mount Ararat as the resting place for the ark and adopt Mount Cilo. I hope to explore the interesting consequences of this conclusion next issue. ◇

Readers Write

Galatians 3:17

Dear Dr. Aardsma,

Galatians 3:17 states that the law was introduced 430 years after the promise to Abraham. Isaac was born around 3070 B.C. so the promise would have had to be given before then. Adding 430 years to this date yields 2640 B.C. But the law was given sometime after the Exodus in 2447 B.C., creating a discrepancy of at least 193 years. Please advise me on how this can be rectified.


T. Basil Finnegan
Broadway, VA


Dear Basil,

Your question is a good one. The "430 years" of Galatians 3:17 has caused much perplexity for many Bible scholars and students. I think the answer is fairly simple, in fact, though it renders Paul's argument in Galatians 3 more profound than is generally recognized.

Galatians 3:16 and 17 read (NASB):

Now the promises were spoken to Abraham and to his seed. He does not say, "And to seeds," as referring to many, but rather to one, "And to your seed," that is, Christ. What I am saying is this: the Law, which came four hundred and thirty years later, does not invalidate a covenant previously ratified by God, so as to nullify the promise.

The one clearly known point in Paul's reference to the 430 years in these verses is the giving of the Law at the end of it. This we know happened at Sinai shortly after the Israelites left Egypt.

Using Old Testament chronology as a guide, next work backward from this known point. What happened 430 years before the Israelites left Egypt? Exodus 12:40 & 41 are very clear about this:

Now the time that the sons of Israel lived in Egypt was four hundred and thirty years. And it came about at the end of four hundred and thirty years, to the very day, that all the hosts of the Lord went out from the land of Egypt."
This "430 years" matches exactly with Paul's "430 years" in Galatians 3:17 and it seems appropriate, if not mandatory, to identify them as one and the same.

This impacts the interpretation of Galatians 3:17. Paul says: "the law which came four hundred and thirty years later", but he doesn't specify what it came later than. It is natural, in the context, if one ignores Old Testament chronology, to assume he means later than the giving of the promises to Abraham. So the verse is usually understood as follows: "the Law, which came 430 years later than the giving of the promises to Abraham, does not invalidate a covenant which was ratified previous to the giving of the Law following the Exodus". But chronological considerations hinder this interpretation and imply that Paul really means "the Law, which came 430 years later than the entrance of Jacob and his family into Egypt, does not invalidate a covenant which was ratified previous to the entrance of Jacob and his family into Egypt".

Why would Paul choose the entrance of Jacob and his family into Egypt as his time reference in verse 17? After all, one might argue, this event is in between the two points in time the passage seems to be dealing with: the giving of the promises to Abraham and the giving of the Law to Moses. Isn't it superfluous and somewhat unnatural to interject the entrance into Egypt at this point in the argument?

I suggest that this interjection is, in fact, highly germane to Paul's overall argument. By it Paul emphasizes that the Law is not primary. Rather, it is God's promises to Abraham which are primary. Subsequent history, including the giving of the Law, is merely a consequence of these promises. I suggest that Paul is here using chronology to invoke the historical image of the entrance of Jacob and his family into Egypt to reinforce and illustrate the fact that the Law is not primary. It is clear to anyone familiar with the Old Testament that the entrance into Egypt was nothing more than an inevitable consequence of God's promises to Abraham. So also the Law. And that which is itself an inevitable consequence of some other event cannot itself be regarded as primary.

Let me attempt to explain in a little more detail.

In the broader context of this passage Paul is arguing that Christ Jesus is the seed promised to Abraham, the One who caused all nations to be blessed in Abraham. The major point of Paul's argument is that the inheritance of the blessing is based on God's promises to Abraham, not on adherence to the Law.

In verse 16 Paul refers to "promises" (plural) given to Abraham. What are these promises? They are: 1. I will make you a great nation (Genesis 12:2); 2. I will bless you (Genesis 12:2); 3. I will make your name great (Genesis 12:2); 4. I will bless those who bless you (Genesis 12:3); 5. I will curse those who curse you (Genesis 12:3); 6. All the families of the earth shall be blessed in you (Genesis 12:3; 22:18); 7. You will have a son (Genesis 15:4; 17:16,19); 8. Your descendants shall be innumerable (Genesis 15:5; 22:17); 9. Canaan will be given to your descendants (Genesis 15:7,18–21; 17:8); 10. Your descendants will be strangers in a foreign land and enslaved 400 years (Genesis 15:13); 11. They will come out of that land with many possessions (Genesis 15:14); 12. You will live to an old age (Genesis 15:15); 13. Your descendants will return to Canaan (Genesis 15:16); 14. You will be father to a multitude of nations (Genesis 17:4,5); 15. I will be your God and the God of your descendants forever (Genesis 17:7); 16. Your descendants will be victorious over their enemies (Genesis 22:17).

I suggest that Paul is using the entrance of Israel into Egypt as his time reference in Galatians 3:17 specifically because, like the more conspicuous Exodus event which took place 430 years later and the giving of the Law which accompanied that event, it was a part of the carrying out of these sixteen promises which God had made to Abraham. It is clear that the entrance into Egypt was not a beginning of something new. Rather, it was a partial fulfilling of something more ancient and more profound. Similarly, the Exodus and giving of the Law were not a beginning of something new. These, too, was merely a partial fulfilling of the more ancient and more fundamental promises which God had made to Abraham long before.

The thrust of the argument is that the Law was given as just another historical item in the flow of the working out of God's promises to Abraham—the Law is in the stream of history which flows from God's promises to Abraham. The Law is not a separate entity unto itself, somehow independent of and superseding the promises. The promises are the fundamental thing—the fountain from which the succeeding stream of history flows. It is the promises which are the essential purpose and focus of God, not the Law. The Law was given to serve in carrying out the promises. It was never intended as an end in itself.

I suggest that Paul assumed his readers were sufficiently familiar with Old Testament history and chronology to get his point without his having to spell it all out. The correspondence between his "430 years" and that of Exodus 12:40–41 is a pretty strong hint, after all. In any event he does not pause to explain as, in the middle of his argument he deliberately moves his time reference along in the flow of history which rises from the giving of the promises to Abraham. But by so moving his time reference he skillfully accentuates his point that the whole flow of history from Abraham on down—including the giving of the Law—is focused on the fulfillment of God's promises to Abraham, ultimately culminating in the eternal inheritance and blessing which those who place their faith in the promised Seed, Christ Jesus, receive.


Gerald E. Aardsma, Ph.D.
Loda, IL

The Biblical Chronologist is a bimonthly subscription newsletter about Biblical chronology. It is written and edited by Gerald E. Aardsma, a Ph.D. scientist (nuclear physics) with special background in radioisotopic dating methods such as radiocarbon. The Biblical Chronologist has a threefold purpose:

  1. to encourage, enrich, and strengthen the faith of conservative Christians through instruction in Biblical chronology,

  2. to foster informed, up-to-date, scholarly research in this vital field within the conservative Christian community, and

  3. to communicate current developments and discoveries in Biblical chronology in an easily understood manner.

An introductory packet containing three sample issues and a subscription order form is available for $9.95 US regardless of destination address. Send check or money order in US funds and request the "Intro Pack."

The Biblical Chronologist (ISSN 1081-762X) is published six times a year by Aardsma Research & Publishing, 412 N Mulberry, Loda, IL 60948-9651.

Copyright © 1997 by Aardsma Research & Publishing. Photocopying or reproduction strictly prohibited without written permission from the publisher.

Footnotes

  1. ^  Gerald E. Aardsma, A New Approach to the Chronology of Biblical History from Abraham to Samuel, 2nd ed. (Loda IL: Aardsma Research and Publishing, 1993).

  2. ^  Gerald E. Aardsma, "Research in Progress," The Biblical Chronologist 1.1 (January/February 1995): 6–7. Gerald E. Aardsma, "Research in Progress," The Biblical Chronologist 1.2 (March/April 1995): 6–8. Gerald E. Aardsma, "Research in Progress," The Biblical Chronologist 1.4 (July/August 1995): 6–10.

  3. ^  Genesis 9:6.

  4. ^  Genesis 7:19–20.

  5. ^  Gerald E. Aardsma, "Chronology of Noah's Flood," The Biblical Chronologist 3.1 (January/February 1997): 1–8.

  6. ^  Gerald E. Aardsma, "Noah's Flood at Elk Lake," The Biblical Chronologist 2.6 (November/December 1996): 1–13.

  7. ^  Gerald E. Aardsma, "Yeroham—The True Mt. Sinai?" The Biblical Chronologist 1.6 (November/December 1995): 1–8. Gerald E. Aardsma, "Biblical Chronology 101," The Biblical Chronologist 2.2 (March/April 1996): 9–12.

  8. ^  For a refutation of one such claim see: R. E. Taylor and Rainer Berger, "The Date of 'Noah's Ark'," Antiquity LIV (1980): 34–36.

  9. ^  For example: W. W. Gasque, "Ararat," The International Standard Bible Encyclopedia, ed. Geoffrey W. Bromiley (Grand Rapids: Eerdmans, 1979), 233.

  10. ^  W. W. Gasque, "Ararat," The International Standard Bible Encyclopedia, ed. Geoffrey W. Bromiley (Grand Rapids: Eerdmans, 1979), 233.

  11. ^  H. A. Hoffner, Jr., "Ararat," The Zondervan Pictorial Encyclopedia of the Bible, vol. 1, ed. Merrill C. Tenney (Grand Rapids: Zondervan, 1976), 255.

  12. ^  "Ararat, Mount," The New Encyclopaedia Britannica, vol. 1 (Chicago: Encyclopaedia Britannica, 1997), 518.

  13. ^  Georges Dumezil, "Armenia," The Encyclopedia Americana (Chicago: Rand McNally, 1962), 266.

  14. ^  The five maps I worked from were F-4C, F-4D, G-4A, G-4B, and G-5A. These were all prepared and published by the Defense Mapping Agency Aerospace Center, St. Louis, Missouri. They can be ordered from: NOAA Distribution Branch (N/CG33), National Ocean Service, Riverdale, MD 20737-1199. I obtained my copies through Map World, 123-D North El Camino Real, Encinitas, CA 92024, (800)246-6277.

  15. ^  The relative likelihood was computed as follows. First the ranks were converted to probabilities by dividing each by the total number of candidates. The six probabilities for each candidate were then multiplied to obtain the combined probability of that candidate looking as similar to the Biblical description of the resting place of the ark as it does. These combined probabilities were then inverted and multiplied by the combined probability of Mount Ararat (Candidate 1) to obtain the relative likelihood.


Volume 3, Number 3May/June 1997

The Depth of Noah's Flood

How many feet above the surface of the modern oceans did the water rise at the time of the Flood? Did the water cover Mount Everest, with its peak some five and a half miles above mean sea level today? What effect would the Flood have had on the great ice sheet that presently covers most of Greenland? Was the water deep enough to cause this massive ice sheet to float? At what rate did the water rise, and at what rate did it fall? How long was the maximum depth maintained? These are a few of the questions which have been raised by recent Biblical chronology research into the date of Noah's Flood.

In this article I seek to provide some quantitative answers to questions regarding the depth of the Flood. I discuss how the depth of the water at various times throughout the Flood can be determined, and I display a graph of the depth of the water of the Flood versus time.

The need for such a graph arose several months ago following the discovery of an anomalously thick sedimentary layer at Elk Lake in Minnesota.[1] This anomalous layer was found to have been deposited within secular dating uncertainties of the Biblical date of Noah's Flood which results when an accidentally dropped millennium is included in 1 Kings 6:1 (i.e., 3520±21 B.C.).[2]

This discovery immediately appeared to corroborate a global Flood, but it refuted the idea that the Flood was a great, geologic cataclysm.[3] The obvious question following the Elk Lake discovery was whether it could be corroborated from other natural reservoirs having well controlled chronologies covering the period of interest. Might evidence of the Flood be expected in the stratified Greenland ice cores which have been drilled during the past several decades, or in long tree-ring sequences, for example? Preliminary consideration of such questions rapidly revealed that a knowledge of the depth of the Flood versus time was needed to aid in answering them.

The time axis for a graph of the depth of the Flood is simply the chronology of the Flood itself. This can be obtained from the Genesis account of the Flood.[4] Depth of the Flood data can also be obtained from the Genesis narrative, providing the mountain the ark came to rest upon can be determined. A comprehensive search of modern mountains in the Ararat region was reported on in the previous issue.[5] It revealed that Mount Cilo, a mountain to the southeast of Lake Van, best fulfilled the requirements of the Biblical text. It was singled out from over 1,400 competing mountains using a quantitative, probabilistic analysis. Mount Cilo was found to be over sixty times more likely to be the mountain the ark landed on than the traditional Mount Ararat, the next most likely candidate. The present study proceeds from and builds upon this basis.

Flood Models

It is normal in science for there to be an interaction between theory and experiment as new discoveries about God's creation are made. Experimental evidence which does not fit within an existing theoretical framework is usually the first indication that some new discovery may be just around the corner. This experimental evidence prompts new theoretical studies and ideas. These, in turn, prompt further experimental investigations. Thus theory and experiment grow up together, side by side.

This is the process we are currently involved in with the Flood.

The ruling theory of the Flood in modern academia is that the Biblical "story" of the Flood is largely or wholly mythological. This theory is rejected by conservative Christians because Christ treated the Flood as an historically factual event.[6] Furthermore, Christians from the time of Christ on have consistently understood the Biblical Flood narrative to be simple, sober history.

The reigning theory of the Flood among conservative Christians at present is the cataclysmic Flood model made popular by Whitcomb and Morris in their book The Genesis Flood.[7] This theory pictures the Flood as a highly energetic geologic cataclysm, responsible for the deposition of most of the geologic column, and accompanied by great earthquakes, tidal waves, unprecedented volcanism, movements up and down and around of whole continents and ocean floors, and general titanic upheaval of the crust of the earth.

This theory has been beset by severe chronological difficulties from its inception.[8] For example, radiometric dating methods belie the claim that the geologic column was laid down all at one time a few thousand years ago. Such difficulties have been avoided by proponents of the theory by denying the cogency of radiometric dating methods and other chronological data—they have never been solved. Indeed, from the vantage point of several decades of research it seems fair to say that this model's chronological problems are unsolvable. This is just another way of saying that this theory is false—it does not correspond to what actually happened at the time of the Flood.

Perhaps the most telling failure of the cataclysmic Flood model for the conservative Christian is its inability to satisfy Biblical chronology. Continuous series of annual tree-rings, ice-layers, and lake sediments exist, each independently extending some ten thousand years into the past. Each of these series shows that a cataclysmic Flood is impossible to accommodate in earth history certainly any more recently than about ten thousand years ago.[9] Meanwhile, even the most cavalier modern Bible chronology must place the Flood certainly within one thousand years of 3000 B.C.—only six thousand years ago at best. Thus a discrepancy of at least four millennia exists between the cataclysmic Flood model and Biblical chronology. This large failure is another evidence that this model is simply not correct.


The existence of an archaeologically revealed hiatus in human populations in the Near East roughly 3500 B.C., coupled with evidence of intense sedimentation at Elk Lake in Minnesota at this same date recently prompted me to advance a new theory of the Flood, called the pelagic Flood model.[10] "Pelagic" means relating to the open sea. I adopted this adjective to convey the idea of a Flood which is characterized by the existence of a universal ocean over the globe of the earth. Tidal waves and other cataclysmic phenomena are, so far, foreign to this model. And just as the oceans are not tearing up and redepositing the sea floor as miles-deep sediments each year at present, so no such activity is anticipated over the surface of the ground during the year of the Flood in the pelagic Flood model.

The pelagic Flood model is not dominated by tectonics (i.e., deformations of the crust of the earth) as the cataclysmic Flood model is. For example, it does not picture the kind of mountain building that the cataclysmic model does at the time of the Flood.[11]

But the pelagic Flood model does not eschew tectonics either. For example, upward flexure of the sea floors would seem one possible way to get the water of the oceans to cover the land during the Flood. Further experimental evidence (similar to the Elk Lake data) is necessary to refine our understanding of the role of tectonics in this theory.

But the silence of the Biblical narrative regarding any of the sorts of phenomena that would surely accompany large-scale, rapid tectonics seems at present to relegate tectonics to a minor role at best during the Flood. It seems most appropriate, at least during this early stage in the development of this model, to approximate the tectonic contribution to the Flood as being zero. This means we picture the Flood, in first approximation, as characterized by mobile water over a static landscape and lithosphere. This has the disadvantage of leaving the question of what impelled the water to move out of the oceans and onto the land without an obvious, immediate answer. But it seems likely that the mechanism of the Flood (i.e, what impelled the water) will clarify as greater familiarity is gained with the empirical data pertaining to the Flood. Meanwhile, this procedure has the great advantage of keeping the discussion centered on the sort of Flood the Bible actually describes, rather than plunging it immediately into imaginative and speculative tectonic scenarios. It allows Noah's Flood to be Noah's Flood, rather than Noah's Great Tectonic Event.

Psalm 104:5–9

I am aware that some may think this approach to the problem unbiblical. They may feel it is blatantly contradicted by Psalm 104:5–9. Those who adhere to the cataclysmic Flood model often point to this passage to support the idea that the continents rose and the ocean basins sank following the Flood. Whitcomb and Morris write, for example:[12]

Very likely, in order to accommodate the great mass of waters and permit the land to appear again, great tectonic movements and isostatic adjustments would have to take place, forming the deep ocean basins and troughs and elevating the continents. This seems to be specifically implied in the poetic reflection of the Deluge in Psalm 104:5–9.

The passage in question reads (NASB):

5. He established the earth upon its foundations,
So that it will not totter forever and ever.
6. Thou didst cover it with the deep as with a garment;
The waters were standing above the mountains.
7. At Thy rebuke they fled;
At the sound of Thy thunder they hurried away.
8. The mountains rose; the valleys sank down
To the place which Thou didst establish for them.
9. Thou didst set a boundary that they may not pass over;
That they may not return to cover the earth.

This passage does seem to be referring to the Flood, but its interpretation in terms of tectonics seems to me to be questionable for a number of reasons.

Notice, first of all, that it is not this whole section of five verses which can be appealed to for support of rising continents and sinking ocean basins (i.e., tectonics), but just one half of one verse. Specifically, the first half of verse 8, which says "The mountains rose; the valleys sank down" is what is utilized. But even this phrase does not say the continents rose and the ocean basins sank down. It says the mountains rose and the valleys sank down. Obviously, it is a rather large leap to change what the text calls "mountains" into continents, and "valleys" into ocean basins. But I recognize that one must be careful about how literally a phrase from poetic verse should be taken, so I will not press this point.

Of greater concern is the fact that the context doesn't seem to support a tectonic interpretation of this passage. The subject of verses 6, 7 and 9 is the water of the Flood, not the mountains or the valleys. The Bible reader is watching the Flood waters in these verses. He is watching the waters in action as they respond to the sovereign voice and will of God. In verse 6 the waters are covering the earth. In verse 7 they are fleeing. In verse 9 they are restrained. It seems foreign to interject moving mountains and valleys in the middle of this focus on the waters, and I believe the psalmist did not intend that we should.

I suggest that the psalmist is not talking about any absolute motion of the mountains and valleys at all here. I suggest that he is simply carrying on with his theme of the waters in motion in response to the will of God. What the poet is describing in verse 8 is not what the mountains and valleys are doing, which would be a change of subject and foreign to the theme of the passage. Rather, he is describing what one sees as a result of what the waters are doing.

Looking out from the ark, one would have seen the mountains emerging from the surface of the retreating waters. The mountains would have appeared to those aboard the ark to be rising up out of the water. Similarly, one would have seen the valleys between the mountains deepening day by day as the surface of the water, which defined the visible bottoms of the valleys at that time, sank lower and lower. They would have appeared to be sinking down.

I suggest that it is this concept which underlies verse 8, rather than any absolute motion of mountains and valleys. The psalmist has already made it clear in verses 6 and 7 that it is the waters which are doing the moving. That the waters have not been set aside as the subject in verse 8 is clear by the fact that they are still the subject of verse 9. Thus the action of the waters should still be regarded as the subject of verse 8, not the action of the mountains and the valleys.

In verse 8 the psalmist is simply using the language of appearance. The action of the waters causes the mountains to appear to be rising up out of the water, and the valleys between the mountains to appear to be deepening. The use of the language of appearance at this point should not cause us any difficulty. Psalm 104 is poetry, after all, not historical narrative, and the use of the language of appearance is, in fact, a very effective poetic technique in this instance.

I suggest that this understanding best fits the context and the poetic nature of the passage, and that it is all the psalmist ever intended.

In any event, it is clear that Psalm 104:5–9 does not lend unequivocal support to the assertion that the Flood was accompanied by rapid, large-scale tectonics by any means, and that it does not demand that we include a tectonic component in the pelagic Flood model.

The Data

Day 0

The first point of interest for constructing a graph of the depth of the Flood versus time is Day 0, immediately preceding the start of the Flood. The depth which we need to know to be able to graph this point is simply the mean sea level back at that time.

Richard G. Fairbanks displays a graph of mean sea level which includes the period in question.[13] It is based on radiocarbon dated corals. It shows that the sea level was 5±1 meters (1σ) below the present mean sea level 5,500 years ago. Thus the depth of the Flood water on Day 0 can be given as -15±3 feet.

Day 150

The single most major piece of quantitative data regarding the depth obtained by the Flood is found in Genesis 8:4. There we learn that "the ark rested upon the mountains of Ararat". My previous work, mentioned above, leads me to understand this as recording the grounding of the ark near the summit of Mount Cilo on Day 150 of the Flood. The implication is that the water of the Flood was just deep enough to barely cover Mount Cilo on Day 150.

Mount Cilo's summit presently stands at 13,566±33 feet (1σ) above mean sea level.[14] One cannot simply assume that this was its height at the time of the Flood, however. I have previously pointed out that a mountain which erodes as little as one inch per year will have lost over 450 feet in 5500 years, the time which has elapsed since the Flood. Additional uncertainties on this order in the absolute depth of the Flood on Day 150 arise from questions of the possible subsidence or elevation of the Ararat plateau since the Flood. Such considerations suggest that the depth of the Flood on Day 150 should probably be regarded as uncertain to within 500 or 600 feet (3σ) of the present height of Mount Cilo. I therefore estimate a 1σ uncertainty of ±200 feet. Rounding the measured elevation to the nearest 100 feet in conformity to this uncertainty yields 13,600±200 feet above mean sea level as the depth of the Flood on Day 150.

Day 222

Genesis 8:5 records that the water decreased steadily after the ark had grounded, and that on Day 222 the tops of neighboring mountains became visible.

Mount Cilo is surrounded by tall mountains. The tallest near neighbor is located about 25 miles (40 km) to the northeast. Its elevation is given on TPC map G-4B as 12,493±100 feet (3σ).[15] By the time the water of the Flood had decreased to this depth, the summit of Mount Cilo would have been (13,566 - 12,493 =) 1,073 feet (327 m) out of water. According to Equation 1 of the previous issue[16] the horizon would have been out at

r = 6371 × arccos[6371/(6371+0.327)]
which equals 65 kilometers (about 40 miles) by that point. Thus this tallest neighboring peak would have been inside the horizon as viewed from Mount Cilo on Day 222 when it first breached the surface of the water. Therefore the depth of the water on that day would have been just equal to the height of the peak of this neighboring mountain. When the uncertainties mentioned above are taken into consideration one obtains a depth of water on Day 222 of 12,500±200 feet.

Day 310

The determination of the depth of the Flood on Day 310 is more dependent on interpretation of the Genesis narrative than the previous data points have been. We learn from Genesis 8:13 that "the water was dried up from the earth" on this day. The interpretive question arises over whether this is intended to be understood in an absolute or a relative sense. Did Noah intend to convey that the region around the mountain over which he looked after he had removed the covering of the ark on Day 310 had come to a terminal state of dryness (similar to what one would see there today), or did Noah mean that the scene was dominated by dry land rather than by water?

Genesis 8:7 may offer some help with this interpretive difficulty. It informs us that the raven which Noah had sent out of the ark "flew here and there until the water was dried up from the earth". Whitcomb and Morris make an interesting connection between Genesis 8:7 and Genesis 8:13, which describes the state of dryness on Day 310, in their Figure 2.[17] The phrase "the water was dried up from the earth" appears in both verses. Apparently, then, the raven was seen flying about until about Day 310.

I am not an expert on the behavior of ravens, but it is clear that the raven is not a sea-going bird. It seems reasonable to suppose that the water surrounding Mount Cilo would constitute somewhat of a barrier to the raven, holding the raven in the vicinity of the ark as long as it was high enough. As the depth of the water decreased and neighboring mountains began to appear, it seems likely the raven could have flown away from Mount Cilo to these other mountains if it had wished to do so. But there is no obvious reason why it would have wished to do so as long as its food supply around Mount Cilo was adequate—which seems likely following such a Flood. Once the water had decreased to the point that a flight of several miles over open water was no longer required for the raven to leave the vicinity of the ark, however, it seems probable that the raven would have strayed away from that vicinity in its daily search for food.

If this speculation on the probable behavior of the raven is reasonably accurate, then it suggests that the raven would certainly have wandered away by the time the water had decreased to 5,750 feet. At that depth Mount Cilo would no longer have been an island. A person would have been able to walk the 25 miles to the first neighbor which had appeared several months previously, completely on dry ground by this point, for example. But the raven was probably still confronted by somewhat of a water barrier when the depth of the water was 7,000 feet. At that depth the raven would still have had to cross a two or three mile stretch of water at the narrowest point to leave the vicinity of Mount Cilo.

These considerations lead me to propose a probable depth of 6,500±200 feet (1σ) on Day 310.

Day 365

Genesis 8:14 records simply that on Day 365 "the earth was dry". At this point Noah and the other occupants of the ark disembarked. One gets the impression that things were pretty much back to normal around Mount Cilo by this point. This suggests a water depth no greater than about 3,500 feet. This is the approximate altitude of the river valleys in the vicinity of Mount Cilo today.

The text does not rule out the possibility that the water had receded much further than this by this point, however. It seems possible that the water may even have returned to its normal, pre-Flood state by Day 365.

An estimate which takes both of these extremes into account is 1,750±600 feet (1σ).

The Graph

The five data points discussed above are shown in Table 1. Figure 1 displays a graph of these points.

Table 1: Depth of the Flood data.

Figure 1: Depth of the water of the Flood, in thousands of feet, versus time. Error bars are ±3σ.

It would be very nice if a theoretical functional form could be fit to these data points. Unfortunately, our present ignorance of the mechanism of the Flood leaves us without the necessary physical basis for such an attempt. But two observations on the nature of such a function seem in order at this time.

First, it appears that the water rose more rapidly than it receded. We know from the Biblical account that the water decreased steadily from Day 150 onward. Thus the Flood must have reached maximum depth on or before Day 150. For the water to have receded as quickly as it rose, the depth would have had to reach zero by Day 300. But in actual fact the water was still over a mile deep by Day 310. Thus the mathematical function describing the depth of the water of the Flood will not be symmetric about any vertical axis.

Second, it seems clear that the rate of recession of the water accelerated with time following attainment of maximum depth. Notice that the rate of recession was more rapid from Day 222 to Day 310 than it was from Day 150 to Day 222. This observation has important consequences for the mechanism of the Flood. For example, if one fills a pail which has a small hole in the bottom of it with water, the rate of recession of water in the pail will decelerate with time. Thus, a "leaky pail" model does not seem an appropriate analog for the mechanism of the Flood.

The Maximum Depth of the Flood

This second observation also allows an absolute upper limit to be set on the maximum depth achieved by the Flood. This can be obtained by extrapolating the known rate of recession of the water between Day 150 and Day 222 backward in time. Since the rate of recession increased with time, it could not have been any greater before Day 150 than it was observed to be after Day 150.

Unfortunately, it is not clear from the Biblical narrative just how far back one should extrapolate. This depends upon when the Flood reached its maximum depth. I find it impossible to determine this with complete confidence from the Biblical narrative.

The text repeatedly mentions the initial forty days and nights of rain.[18] This period seems certainly to have been one of rapidly increasing water depth. But it is not clear whether the Flood reached maximum depth on Day 40 or whether it went on increasing at a somewhat slower rate after Day 40.

The text is explicit that the water decreased from Day 150 onward.[19] So it is certain that the Flood obtained its maximum depth sometime before Day 150. But it seems possible, from the information given in the Genesis narrative, for maximum depth to have been achieved anywhere between Day 40 and Day 150.

This uncertainty seems to me to merely reflect Noah's inability to determine when the Flood had reached maximum depth. Once the ark had grounded, on Day 150, Noah would have been able to tell that the water was receding by direct observation. The ark would have settled into place as the water lowered, the horizon would have grown more distant, and the line of the horizon would have sunk ever lower below the horizontal plane.

But prior to Day 150, once all visible land had been submerged, Noah would have had no way of telling whether the Flood was increasing or decreasing. Even if he had been able to take soundings, a ship adrift over mountainous terrain would not have yielded systematic results.

There seems no way to remove this uncertainty, so we must work with it. What seems reasonably clear, in any case, is that the Flood did not reach its maximum depth prior to Day 40. So an absolute greatest maximum depth can be calculated by extrapolating the absolute maximum depths on Day 150 and Day 222 back to Day 40. (Notice that the uncertainties in the depth of the Flood on these two days are correlated, not independent. They are due to factors such as erosion and uplift which should behave in a similar fashion for Mount Cilo and its near neighbors, from which these points are determined.) Such an extrapolation leads to the conclusion that the water did not exceed 15,900 feet above today's mean sea level at any point during the Flood.

Coverage of the Flood

I have previously discussed the fact that two different points of view exist, leading to two different interpretations of the Flood account in Genesis.[20] One view interprets much of the narrative from a global frame of reference. In this view the narrative is seen as a record of God's observations during the Flood. The other view interprets most of the narrative from a local frame of reference. In this view the narrative is seen as a record of Noah's observations during the Flood.

Genesis 7:19 says (NASB), "And the water prevailed more and more upon the earth, so that all the high mountains everywhere under the heavens were covered." To those who adopt the first viewpoint, this seems to guarantee that the waters of the Flood covered every square inch of land over the entire earth. In the second viewpoint, no such guarantee exists. If Genesis 7 is a record of Noah's observations, then verse 19 merely records that every mountain within Noah's visible horizon had been covered by water. Thus, the second viewpoint admits the possibility that, though the Flood was a global phenomenon rather than just a local or regional event, some very tall mountains or other high elevations, outside of Noah's visible horizon, may still have remained above the level of the water throughout the Flood.

As I have stated previously, I am of the persuasion that the Flood narrative should be interpreted from the second viewpoint. I have worked consistently within this framework throughout this entire study of the Flood. We have now reached the point where the question of the coverage of the Flood which arises within this framework can be addressed for the first time.

We feel confident that the Flood obtained a depth of at least 13,000 feet above mean sea level, and we have concluded that it may have reached as much as 15,900 feet. There are very few places on Earth which reach such elevations. There are some mountains scattered about the globe which do so, and there is one region which does so. The mountains include, for example, Everest in Asia (29,000 feet), McKinly in Alaska (20,300 feet), El'brus in Europe (18,500 feet), Kilimanjaro in Africa (19,300 feet), Aconcagua in South America (23,000 feet), and Vinson Massif in Antarctica (16,900 feet). The one region is the Tibetan Plateau in Asia, the "roof of the world", which is believed to have an average elevation of about 16,000 feet. Because of the extreme elevations involved, all of these places are cold and barren and otherwise not conducive to human occupation.

The Tibetan Plateau occupies about 0.4% of the surface area of the earth. If the 40 days and nights of rain which Noah observed were a global phenomenon, then it is possible that this plateau also experienced extensive flooding at the time of the Flood. This would have been a fresh-water flooding however, in contrast to the salt-water flooding experienced by the rest of the globe.

Be that as it may, 0.4% seems to be a reasonable upper limit on the surface area of the earth left exposed by the Flood. This means that in the pelagic Flood model Noah's Flood seems to have covered at least 99.6% of the earth's total surface area.

Greenland Ice Sheet

Was the Flood deep enough to cause the Greenland ice sheet to float? The answer now appears to be yes.

The Greenland ice sheet covers 708,000 square miles today. The average elevation of the ice appears to be about 7,000 feet. The ice was drilled completely through to bedrock at the Dye 3 site, yielding a measured ice thickness of 2,037 meters (6,683 feet).[21]

If we take the present elevation as representative of this ice sheet at the time of the Flood, it is clear that the water of the Flood would have lifted the entire ice sheet at least (13,600-7,000=) 6,600 feet above its bed, since ice is less dense than water.

The fact that the deepest ice within the Greenland ice sheet today considerably predates the Flood shows that the pre-Flood Greenland ice sheet did not simply drift away from Greenland at the time of the Flood. This is not too surprising. In addition to the immense inertia involved, the low inland plateau on which the ice sheet rests is surrounded by a strip of coastal mountains, the highest of which is 12,139 feet. Apparently these acted to keep the pre-Flood ice sheet anchored to Greenland throughout the Flood.

This is somewhat unfortunate as far as finding evidence of the Flood in the Greenland ice sheet is concerned. If the ice sheet had drifted away at the time of the Flood, the present ice sheet would only have begun to accumulate after the Flood. The age of the ice at the bottom of the modern ice sheet would, in that case, have simply corresponded to the date of the Flood.

How Much Water?

One of the most basic calculations which can be made at this point is to determine the percentage of the water in the modern oceans which is required to cover the continents to 13,600 feet. Such a calculation should help provide some additional insight into the mechanism of the Flood.

George D. Garland gives the mean depth of the oceans as 3,800 meters, and their surface area as 3.61×10¹⁴ square meters.[22] This yields a present volume of water in the oceans of 1.37×10¹⁸ cubic meters.

Garland gives the mean height of the continents as 840 meters, and their surface area as 1.49×10¹⁴ square meters. To cover this surface area (i.e., just the continents) with water to a depth of 13,600 feet (4,145 meters) would require 4.92×10¹⁷ cubic meters of water. This is 36% of the volume of the water in the oceans today.

To cover the entire globe with water to an altitude of 13,600 feet above mean sea level today would require an additional 1.50×10¹⁸ cubic meters of water, or 1.99×10¹⁸ cubic meters total. This requires 45% more water than exists in the oceans today.

To get a feel for what this means, it is helpful to make a brief excursion into the world of tectonics. Let us imagine for a moment (I am not proposing this as a theory) that the Flood was caused by the ocean floors simultaneously and uniformly rising up all over the globe. (More or less equivalently, one can imagine the continents sinking down instead if one prefers.) The numbers say that even if the ocean floors were everywhere raised to the height of the surface of the oceans today, the water would still not cover the continents to 13,600 feet. To get the water to 13,600 feet over the continents, one would need the ocean floors to stand some 870 meters (2900 feet) above the mean height of the continents today. This means the ocean floors would need to be raised (or the continents would need to sink down) 5,500 meters (18,000 feet or 3.4 miles!) above their present level.

It is clear that a lot of water was somehow displaced from the oceans at the time of the Flood. How this was accomplished is presently a most fascinating mystery. Until this mystery is solved we cannot claim to have an accurate conception of the Flood. I point this out here mainly to emphasize that the pelagic Flood model is still at an early stage in its development. Though we have made some astonishing progress in understanding what the Flood was like, we have yet much to learn.

Impact of the Flood

Figure 2: Altitudes at which a few modern cities are situated relative to the depth of the Flood. The depth of the Flood is indicated by the dashed line through the data points discussed in the article, assuming the Flood reached maximum depth on Day 40. Cities are placed on the graph at their appropriate altitudes. The altitude/depth scale is given in thousands of feet to the left of the graph and in miles to the right.

Figure 2 attempts to portray the impact that the Flood must have had on the population of Noah's day by comparing the depth of the Flood to the altitude of a few modern population centers. It is apparent that had New York city been around at that time, for example, it would have been under water for essentially the entire year. The water would have covered it to a depth greater than two miles for probably more than half of the year. Even Denver, Colorado, at its unusually high altitude, would have been covered by over a mile of water for much of the year.

Clearly, the Flood would have had an absolutely catastrophic impact on human civilization. Indeed, there is every reason to believe that the existence of humans on Earth would have been terminated completely had it not been for God's forewarning and Noah's obedience. ◇

Biblical Chronology 101

On "Putting Science Above the Bible"

I received a letter recently from an obviously irate Christian brother. This brother serves on the faculty of a theological institute. He was upset because he felt, as another brother once put it, that I was "putting science above the Bible". He wrote, "Scripture is to hold sway. Science, whether radiometry or dendrochronology must serve Scripture, not vice-versa as in your method and principles".

Is my application of scientific data to problems in the field of Biblical chronology "putting science above the Bible"?

Let me state clearly that I hold to the inerrancy of Scripture in the autographs and to the authority of Scripture in all areas of life, including history and chronology. That is not at issue here. Let me also state clearly that I do not hold to any doctrine of the infallibility or authority of science. So it should be perfectly clear that I am not, in fact, "putting science above the Bible". What I am doing—what conservative Christians have always done—is insisting that science has a legitimate role to play in exposing faulty interpretations of the Bible.

Christians face the very real problem that the Bible can be made to say many things that God never intended it to say. Well-intentioned theologians can study the same Scripture passages and arrive at opposite conclusions regarding what these passages mean. Evidently it is possible to honestly believe the Bible teaches some things that it, in fact, doesn't teach. How is one to separate mistaken interpretations from correct ones?

This same problem has been faced throughout history. The ancient Israelites, for example, encountered the problem in regard to prophets. How were they to know whether a prophet was actually speaking for God, or whether he was merely claiming in God's name that which God had not spoken?

Moses raised this problem and gave its solution in Deuteronomy 18:21–22.

And you may say in your heart, "How shall we know the word which the Lord has not spoken?" When a prophet speaks in the name of the Lord, if the thing does not come about or come true, that is the thing which the Lord has not spoken. The prophet has spoken it presumptuously; you shall not be afraid of him.

Notice how this test works. Notice that what actually happens in the physical world is used as the means of determining whether the prophet has faithfully spoken for God or not.

To the Christian, therefore, the evidence from the physical world (i.e., the scientific data) has an important role to play in weeding out error. God has graciously given us the physical world as a check on our thinking about the Bible, to keep us from being misled by erroneous interpretations of Scripture.

In my experience, those who make the "putting science above the Bible" charge do so because they hold a particular interpretation of the Bible which they wish to protect from examination or correction. The "prophecies" about the nature and history of the world which they have made from their interpretation of Scripture have been called into question by data from the physical world. But they refuse to allow that they may have "spoken it presumptuously". So they declare that those who apply the test of Deuteronomy 18:21–22 are impious. They insist on submission to their interpretation regardless.

Please note the following very important principle. Since God is the Author of the Word and also the Creator of the world, these two sources of knowledge—the Bible and the scientific data—will harmonize when both have been properly understood. Correct Biblical exegesis has nothing to fear from correctly performed science, and vice versa. There is no legitimate reason to mute the testimony of either the Bible or science. Those who genuinely wish to know the truth will want to hear both, without distortion or censure of either.

Bringing the data of science to bear on Biblical matters is not "putting science above the Bible". It is merely applying a procedure to the problem of sifting truth from error which the Bible itself prescribes and has endorsed for a very long time. ◇

Readers Write

My purpose in publishing letters in this column is generally pedagogical. I try to address common questions so everybody benefits from the answer. I also try to correct misunderstandings so we can all move forward in harmony.

I realize that this purpose can lead readers to mistakenly conclude that everybody who writes to me either questions my research or misunderstands it! Such a perception is far from the truth. I get many letters which are just appreciative expressions of encouragement, which never show up here. (I am much more concerned that my readers have answers to their questions, and that misunderstandings be put right, than I am that everybody see how appreciated The Biblical Chronologist is by its readers.) So please don't read this column to try to get a feel for what everybody is thinking—the sample is severely biased. Read it to gain a better understanding of Biblical chronology today. That's why it is here.

Of Fact or Fiction

In the Volume 2, Number 3 issue of The Biblical Chronologist I presented three criteria which can be used to separate fact from fiction in the matter of attempting to harmonize Biblical and secular chronologies of earth history. My advice there was:[23]

So before you bother to wade into yet another supposed synthesis of Biblical and secular historical data, ask yourself these simple questions:
  1. Does this author have a positive and respectful attitude toward Biblical, secular historical, and physical (such as radiocarbon) chronological data?

  2. Does this author give chronological data, of all sorts, precedence in his reconstruction of history (as opposed to the presentation of a mass of historical facts)?

  3. Does this author exhibit knowledge of and competence in handling chronological data of all sorts?

If the answer to any of these questions is no, wade in only if you enjoy reading historical fiction.

Two issues later I used these three criteria in my review of a new book written by David M. Rohl called Pharaohs and Kings: A Biblical Quest.[24] Pharaohs and Kings presented the radical chronological thesis that the late second millennium B.C. chronology of Egypt should be reduced by some 300 to 350 years. It claimed that such a reduction would bring the secular history of this period into better harmony with Biblical history.

I didn't give the book very high marks at the time—and still don't. I showed that the book failed to satisfy any of the three criteria above. My conclusion was, and is, " Pharaohs and Kings is a fine example of the historical delusions one is easily made prey to when legitimate chronological constraints are removed from any discussion of historical facts and archaeological artifacts".[25]

Unfortunately, Rohl's book said some things which some conservative Christians would very much like to be true. It offered the easy thesis (for conservative lay Christians, that is) that traditional Biblical chronological scholarship has all been more or less sound, while secular chronological scholarship is all messed up. So I have not been surprised to see a number of reviews of Rohl's book by conservatives ranging in tone from happy applause to adulation—none of the reviewers being chronologists, of course.

Subsequent to my review a friend and subscriber, who was not altogether happy with my appraisal of Rohl's book, sent me a letter containing the following paragraph.


Dear Dr. Aardsma,

Concerning your three guidelines on page 3 of Volume 2 Number 5 for evaluating a book, please forgive me for having trouble with them. All three seem to have an underlying message that "chronological data" must have precedence. Number 1 says an author should have a positive attitude toward this data, 2 says he should give it precedence over a mass of historical facts, and 3 says he should be competent in handling it. Thus I see these three guidelines as one: rely on "chronological data," whatever that is. It's not clear to me what you mean by this term. I have a hard time understanding it as separate from a "mass of historical facts" or archaeological facts or any other knowledge, for that matter. My best guess as to your definition of the term is: the results of radiocarbon dating. I am not ready to hang my conclusions on such dating methods above all other considerations.

Ruth Beechick
Golden, CO


Dear Ruth,

You are right that all three criteria have the same basis, and you are correct in identifying that basis as " 'chronological data' must have precedence". You will recall that discussion of this basis was the central thrust of the "Biblical Chronology 101" article in which the three criteria were initially advanced.[26] There I called this basic principle Rule #1 to stress its importance. Recall:

Rule # 1 Chronology must precede history.

By this rule I mean one must get the chronology of events right before any attempt is made to reconstruct history from those events. The three criteria are simply three independent ways of evaluating whether an author is likely to have violated this important rule. They ask: 1) Does the author want to give chronological data proper precedence?, 2) Does the author try to give chronological data proper precedence?, and 3) Is the author able to give chronological data proper precedence?

So we agree on the cladistics of my three criteria; your confusion over the distinction between "chronological data" and "a mass of historical facts" is where the problem really lies. This is an important distinction which I have evidently gone over too quickly. Let me attempt to redress this fault by using the following example as a brief review.

Here are some historical facts:

  1. On a stormy winter's night Washington crossed the Delaware, surprised the British at Trenton, and captured 1,000 prisoners.

  2. Lincoln's presidency was marked by bloody conflicts on American soil.

  3. In the Emancipation Proclamation Lincoln declared that all slaves in states, or parts of states, that were in rebellion would be free.

  4. Kennedy took rapid, strong measures when he learned of a military threat to American cities by a foreign power.

  5. Kennedy was shot to death by an assassin as he rode through the streets of Dallas, Texas.

  6. Kennedy, Washington, and Lincoln were Presidents of the United States.

Now let me play the role of pseudo-harmonizer's advocate briefly. Assume we are living about 3,000 years in the future and much of American history has been lost and forgotten, but the truth of the few statements enumerated above has been unequivocably established. Let me reconstruct a little "American history" from these facts. I will indent my effort below to make it clear that it is intended as an example only. (I beg forbearance on the part of my British readers, whom I regard with high esteem and with no admixture of malice.)

Kennedy, Washington, and Lincoln were Presidents of the United States. They took office one after the other in rapid succession. Professor X has suggested that their administrations were dominated by conflict with Britain over the issue of American Independence. Kennedy was the first to come to power. He took rapid, strong measures when he learned of a military threat to American cities by a foreign power. He was shot to death by an assassin—presumably an agent of the British crown—as he rode through the streets of Dallas, Texas. Britain appears to have taken advantage of the chaos which naturally follows loss of national leadership to flood the country with troops. But in a move which demanded great courage, Washington, Kennedy's eventual successor, crossed the Delaware, surprised the British at Trenton, and captured 1,000 prisoners—all on a stormy winter's night. Washington's vigorous action against the British was evidently insufficient to dislodge them, however, for the tenure of the next President, Lincoln, is also marked by many bloody conflicts on American soil. Indeed, in the Emancipation Proclamation Lincoln declared that all slaves in states, or parts of states, that were in rebellion would be free. This shows that the British had, by Lincoln's administration, enslaved many Americans. Lincoln's proclamation was a strong political move—an assertion that the brave people of states which continued in rebellion against the British oppression would ultimately win their freedom.

The normal human reaction to absurdities is to laugh. I hope you have laughed at my reconstruction of "American history" above.

What is it that makes this reconstruction absurd? Please note that it is not a lack of historical facts. Notice that I have included all six of the factual statements enumerated above in my brief, twelve sentence reconstruction. What leads to its absurdity is only that the chronology is all wrong.

Chronological data are definitely different from historical facts. Historical facts deal only with what happened. Chronological data deal with when things happened.

The recitation of historical facts is not enough to guarantee a factual recitation of history. One can create an infinite number of false histories using historical facts. With so many possibilities to choose from, it is inevitable that some of these false histories will seem very persuasive. It is hopeless to try to find the truth by picking the "historical reconstruction" that we feel is most persuasive. Only chronological data can accurately unlock the mystery of the past and separate the one, lone, factual reconstruction of history from the infinite number of false histories which can be devised from any assemblage of historical facts.

The chronological data which are needed in the above example can be supplied in a variety of ways: from dated letters written by these Presidents, or contemporary newspaper reports of the actual events, or radiocarbon dates on personal items such as shoes or canes belonging to these Presidents.

Chronological data from written records exist in relative abundance today for these three Presidents. These data quickly reveal that Washington crossed the Delaware on the night of December 25–26 in A.D. 1776; that the Emancipation Proclamation was officially made by Lincoln on January 1, 1863; and that Kennedy was shot on November 22, 1963. When these chronological data are added to the historical facts enumerated above, my reconstruction of American history quickly collapses. They show that these Presidents did not hold office in the sequence stated, and that they were not contemporaries.

This is the way it always is. Chronological data are death to false reconstructions of history—which is why they are eschewed by so many purveyors of reconstructed "histories".


You say you do not trust radiocarbon dating. Neither once did I. But I have spent several decades investigating the matter, and I have found that my distrust was misplaced. Modern tree-ring calibrated radiocarbon dates, such as I applied to Rohl's thesis, have proven themselves to be reliable repeatedly. I hold radiocarbon dating to be a gift from God to those who are really seeking to understand the truth about the past. I believe that any careful, honest study of the facts will ultimately arrive at the same conclusion.

But I have not asked you to put your trust in my experience or evaluation. Nor have I asked you to exercise blind faith in regard to radiocarbon. Note how I applied radiocarbon to Rohl's thesis. I did not use it to derive the secular chronology of Egypt. The Egyptologists had already done that using written records entirely independent of radiocarbon. Rohl said the Egyptologists were wrong—that the secular chronology of Egypt should be rearranged to suit his particular reconstruction of the history of Egypt. I used radiocarbon data merely as an independent test of these different chronologies. I found that radiocarbon repeatedly confirmed the chronology the Egyptologists had worked out from their written sources, and refuted the chronology Rohl's reconstruction required. If radiocarbon was an unreliable dating method, it should not have given clear testimony to either chronology. Yet, in fact, it sided repeatedly and unequivocally with the Egyptologists and against Rohl.


I created a laughable absurdity from American history by making Kennedy a contemporary of Washington. Note that this is a chronological error of only 200 years. Rohl has made Ramesses II to be a contemporary of Rehoboam—a chronological error of over 300 years. Should conservative Christians applaud?


Gerald E. Aardsma, Ph.D.
Loda, IL

The Biblical Chronologist is a bimonthly subscription newsletter about Biblical chronology. It is written and edited by Gerald E. Aardsma, a Ph.D. scientist (nuclear physics) with special background in radioisotopic dating methods such as radiocarbon. The Biblical Chronologist has a threefold purpose:

  1. to encourage, enrich, and strengthen the faith of conservative Christians through instruction in Biblical chronology,

  2. to foster informed, up-to-date, scholarly research in this vital field within the conservative Christian community, and

  3. to communicate current developments and discoveries in Biblical chronology in an easily understood manner.

An introductory packet containing three sample issues and a subscription order form is available for $9.95 US regardless of destination address. Send check or money order in US funds and request the "Intro Pack."

The Biblical Chronologist (ISSN 1081-762X) is published six times a year by Aardsma Research & Publishing, 412 N Mulberry, Loda, IL 60948-9651.

Copyright © 1997 by Aardsma Research & Publishing. Photocopying or reproduction strictly prohibited without written permission from the publisher.

Footnotes

  1. ^  Gerald E. Aardsma, "Noah's Flood at Elk Lake," The Biblical Chronologist 2.6 (November/December 1996): 1–13.

  2. ^  Gerald E. Aardsma, A New Approach to the Chronology of Biblical History from Abraham to Samuel, 2nd ed. (Loda IL: Aardsma Research and Publishing, 1993). Gerald E. Aardsma, "Chronology of the Bible: 5000–3000 B.C.," The Biblical Chronologist 2.4 (July/August 1996): 2–3.

  3. ^  Gerald E. Aardsma, "Noah's Flood at Elk Lake," The Biblical Chronologist 2.6 (November/December 1996): 1–13. Gerald E. Aardsma, "Research in Progress," The Biblical Chronologist 2.4 (July/August 1996): 9–14.

  4. ^  Gerald E. Aardsma, "Chronology of Noah's Flood," The Biblical Chronologist 3.1 (January/February 1997): 1–8.

  5. ^  Gerald E. Aardsma, "The Ark on Ararat?," The Biblical Chronologist 3.2 (March/April 1997): 1–12.

  6. ^  Luke 17:26–30.

  7. ^  John C. Whitcomb, Jr. and Henry M. Morris, The Genesis Flood (Philadelphia: The Presbyterian and Reformed Publishing Company, 1961).

  8. ^  John C. Whitcomb, Jr. and Henry M. Morris, The Genesis Flood (Philadelphia: The Presbyterian and Reformed Publishing Company, 1961), 332.

  9. ^  See, for example, Gerald E. Aardsma, "Research in Progress," The Biblical Chronologist 2.4 (July/August 1996): 9–14.

  10. ^  Gerald E. Aardsma, "Noah's Flood at Elk Lake," The Biblical Chronologist 2.6 (November/December 1996): 10.

  11. ^  John C. Whitcomb, Jr. and Henry M. Morris, The Genesis Flood (Philadelphia: The Presbyterian and Reformed Publishing Company, 1961), 127–128.

  12. ^  John C. Whitcomb, Jr. and Henry M. Morris, The Genesis Flood (Philadelphia: The Presbyterian and Reformed Publishing Company, 1961), 121–122.

  13. ^  See Figure 2 (p. 639) of: Richard G. Fairbanks, "A 17,000-year glacio-eustatic sea level record: influence of glacial melting rates on the Younger Dryas event and deep-ocean circulation," Nature 342 (7 December 1989): 637–642.

  14. ^  Map TPC G-4B, Defense Mapping Agency Aerospace Center, St. Louis, Missouri.

  15. ^  Map TPC G-4B, Defense Mapping Agency Aerospace Center, St. Louis, Missouri.

  16. ^  Gerald E. Aardsma, "The Ark on Ararat?," The Biblical Chronologist 3.2 (March/April 1997): 8.

  17. ^  John C. Whitcomb, Jr. and Henry M. Morris, The Genesis Flood (Philadelphia: The Presbyterian and Reformed Publishing Company, 1961), 8.

  18. ^  Genesis 7:4,12,17.

  19. ^  Genesis 8:3.

  20. ^  Gerald E. Aardsma, "Chronology of Noah's Flood," The Biblical Chronologist 3.1 (January/February 1997): 6.

  21. ^  H. B. Clausen and C. C. Langway, Jr., "The Ionic Deposits in Polar Ice," The Environmental Record in Glaciers and Ice Sheets, ed. H. Oeschger and C. C. Langway, Jr. (New York: John Wiley & Sons, 1989), 226.

  22. ^  George D. Garland, Introduction to Geophysics, (Toronto: W. B. Saunders Company, 1979), inside front cover.

  23. ^  Gerald E. Aardsma, "Biblical Chronology 101," The Biblical Chronologist 2.3 (May/June 1996): 10.

  24. ^  Gerald E. Aardsma, " 'Pharaohs and Kings' A Biblical Quest?" The Biblical Chronologist 2.5 (September/October 1996): 1–10.

  25. ^  Gerald E. Aardsma, " 'Pharaohs and Kings' A Biblical Quest?" The Biblical Chronologist 2.5 (September/October 1996): 4.

  26. ^  Gerald E. Aardsma, "Biblical Chronology 101," The Biblical Chronologist 2.3 (May/June 1996): 9–10.


Volume 3, Number 4July/August 1997

Noah's Flood at Devon Island

Vast ice sheets, often over a mile thick, cover many land areas in the polar regions of the globe today. These are the result of the buildup of annual snowfall over thousands of years. The oldest ice in these ice sheets predates Noah's Flood by millennia. What impact would Noah's Flood have had on these ice sheets? What can these ice sheets tell us about the date and nature of Noah's Flood? The following article deals with these and related questions. It shows that Noah's Flood was a real historical event which occurred roughly 3500 B.C.


In the November/December 1996 issue of The Biblical Chronologist I introduced the pelagic Flood model.[1] The conceptual basis for this model is summarized by the following three statements:

  1. Noah's Flood was a real historical event.

  2. Noah's Flood is accurately portrayed in Genesis.

  3. Biblical chronology, properly done, dates Noah's Flood to 3520±12 B.C.[2]

In its present (infant) stage of development the model itself can be summarized by two statements:
  1. Noah's Flood was characterized by the existence of a near-global ocean for a significant fraction of one year near 3500 B.C.[3]

  2. The surface of the Flood-ocean rose some two to three miles above the elevation of the surface of the present day oceans of the world.[4]

This conception of the Flood stands in contrast to the nearly unanimous view of secular academia at present that the Genesis story of Noah's Flood is largely or wholly mythological.[5] It also stands in contrast to the cataclysmic Flood model which pictures Noah's Flood as dominated by titanic upheaval within the crust of the earth, and massive sedimentation globally.[6] Finally, it stands in contrast to the local Flood model which sees the Flood as a relatively mild, local inundation.[7]

I was caused to advance the pelagic Flood model by sediment thickness data from the bottom of Elk Lake, Minnesota, in combination with archaeological data from the Middle East. The archaeological data revealed a sudden, widespread termination of civilization near 3500 B.C. in immediate harmony with the Biblical account of the Flood.[8] But there was no evidence that this termination was accompanied by catastrophic upheaval within the crust of the earth. To the contrary, archaeological remains from before this termination were well preserved, and were generally found in the stratified sequences normal to archaeology.

The Elk Lake sedimentary data provided a geological counterpart to the archaeological data. They too failed to show any evidence of cataclysmic upheaval.[9] What they did reveal was an apparently annual accumulation of sediment some 500 times thicker than normal at 3500 B.C.[10] This seemed to provide geologic evidence that the Flood was indeed a world-wide phenomenon—that the earth was covered by a world-wide ocean at the time of the Flood.

The testimonies of these three sources of information regarding the Flood—the Genesis account, the archaeological data from the Middle East, and the geological data from Elk Lake—summed to produce an image of a global, non-cataclysmic, ocean-like Flood near 3500 B.C. Hence the pelagic Flood model was born.

But the possibility remained that the anomalously thick annual layer of sediment found at Elk Lake might have been caused by some unknown process which was unrelated to Noah's Flood. It was possible (though it did not seem probable) that this anomalously thick layer dated to the same time as Noah's Flood by mere coincidence. An independent check of this geologic evidence was clearly called for to settle this question.

The present article fills the need of this independent check. It investigates the thousands-of-years record of snow accumulation in Arctic ice sheets. It finds the pelagic Flood model to be strikingly confirmed by these ice sheets, and other views of the Genesis Flood to be demonstrated false.

The Check

The Elk Lake sediments constitute a natural reservoir of year-by-year data stretching back some ten thousand years. To carry out the desired check of the pelagic Flood model another such natural reservoir of year-by-year data was needed. In addition to this fundamental chronological requirement of year-by-year data stretching back on the order of ten thousand years, this other reservoir needed to meet several criteria to be of use in the present context. To avoid the possibility that lakes were all somehow affected by an event near 3500 B.C. which was unrelated to the Flood, it was clear that this other reservoir should not be another lake. Additionally, this other reservoir should be one on which the expected impact of the pelagic Flood would be large, so that the Flood could not possibly be missed in its year-by-year record. And, to provide a rigorous test of the model as it currently stands, this other reservoir should be one on which the impact of the Flood might be predicted in some detail.

These requirements constitute a very tall order. There are not many year-by-year chronologies stretching back ten thousand years in the natural world. But there are two possibilities which are somewhat prominent today because of the considerable coverage they have received within the technical scientific literature in recent decades. These two obviously deserve investigation. They are tree-rings and ice cores.

Tree-rings

As it turns out, tree-rings are not suitable to the present check. The reason for this is that the impact of the pelagic Flood on the tree-ring data set is not expected to be large.

To see this, consider the bristlecone pine chronology as an example. This is the first and most spectacular, long chronology of tree-rings to have been developed.[11] It stretches in an unbroken sequence of overlapping ring patterns from both living and dead trees back to 6700 B.C.[12]

The bristlecone pine trees from which this chronology was constructed live at an elevation of 10,000 to 11,000 feet in the White Mountains of California.[13] The pelagic Flood model specifies that this elevation would have been under about a half mile of ocean water for about half a year during the Flood.[14] Thus the bristlecone forest probably spent about six months in a cold, dark, ocean-floor environment during the Flood. Since it is obviously difficult to immerse a bristlecone pine forest a half mile deep in ocean water for half a year at present, there is an understandable dearth of experimental data on what such an immersion would do to such a forest. But several characteristics of these trees suggest that such an episode might not leave a detectable impact on their ring growth.

The length of the growing season for bristlecone pines in the White Mountains today is only about 45 days.[15] If the pelagic Flood inundated these trees for a number of months during their ten and a half months of natural dormancy it seems possible they may have been able to resume their usual growth with relatively little upset following the Flood. On the other hand, if the Flood covered these trees during the normal growing season, ring growth may have been highly attenuated on all bristlecones for the Flood year. But these trees grow in a difficult environment in any case, so that very narrow or even entirely absent annual rings are hardly a unique circumstance. Ferguson notes, for example, that "in some instances, 5 percent or more of the annual rings may be missing along a given radius that spans many centuries".[16] Thus, the same outcome seems to follow whether the bristlecones were weakly or strongly impacted by the Flood—the impact of the Flood does not seem likely to be easily detected within the record of their rings.

Bristlecone Chronology

In contrast to its less-than-obvious impact on tree-rings, the pelagic Flood may have had a detectable impact on the bristlecone pine chronology itself. It may have made extension of the chronology to more than a few thousand years before the Flood very difficult. The reason for this is that any dead remnants of trees not anchored to the forest floor at the time of the Flood would have been floated away by the Flood. Such dead remnants would naturally have contained most of the oldest wood present within the bristlecone pine forest at the time of the Flood. Thus I would expect the Flood to make the task of locating very old wood today—from more than one or two millennia before the Flood—unexpectedly difficult.

This expectation could probably be suitably quantified and tested by working with data which might be gathered from the present-day bristlecone pine forest. Unfortunately, I have not been able to find any data of the sort which is needed for such a study in the published literature at present, so it seems impossible to pursue this particular possibility any further here.

The conclusion regarding tree-rings is, therefore, that they do not seem to lend themselves immediately to the independent check of the pelagic Flood model which we require.

Please do not misunderstand this conclusion. I am not suggesting that no effect of the Flood on tree-rings will ever be found, by any means. I fully expect the opposite, in fact. But at this stage in the overall argument a blatant, unavoidable, obvious sort of evidence is needed, and tree-rings do not seem to furnish that kind of evidence.

Fortunately, quite the opposite conclusion applies to ice cores.

Ice Cores

Sheets of ice of great thickness are found to cover both large and small land areas in the polar regions of the globe today. The pelagic Flood model expects no major difference in the pre-Flood and post-Flood climates,[17] so these large ice sheets are expected to have existed pre-Flood as well, and simple chronological considerations show that indeed they did. What impact would the pelagic Flood have had upon these ice sheets?

Two possible causes of unusual effects upon these ice sheets during the Flood immediately suggest themselves. The first cause is an unusual annual accumulation of precipitation in the year of the Flood. This is suggested by the forty days and nights of rain which Noah observed. The second cause is the action of the Flood water itself on these large ice masses.

Forty Days and Nights of Rain

The effects of the first cause are, unfortunately, difficult to predict. This difficulty arises in a number of ways. For one thing we do not know whether Noah's observation of forty days and nights of rain implies similarly intense, prolonged precipitation globally, or whether this particular manifestation of the Flood was merely a local phenomenon. Additionally, we do not know what form precipitation would have fallen in (i.e., whether rain or snow) in the polar regions at the time of the Flood. There is no reason to suppose it fell everywhere in the same form. It probably varied spatially as well as temporally in form and frequency during the Flood.

If the surface of an ice sheet was above water at the time of the Flood (more on this below) and there was intense and prolonged precipitation at that ice sheet in the form of snow, then an unusually thick annual layer of ice should be found today within that ice sheet at the depth corresponding to 3500 B.C. If, on the other hand, rain was received instead of snow, then some meltback of the top ice might be expected. In that case a hiatus in ice chronology would be expected immediately prior to 3500 B.C.

Notice that the foregoing scenarios lead to opposite predictions—an unusually thick layer in the one case, and meltback in the other. Clearly our ability to make a definitive prediction of the effect of the forty days and nights of rain on the polar ice sheets is not good.

But we are able to do much better with the second cause—the action of the Flood water on the ice sheets.

Action of the Flood Water

We can predict with a high degree of confidence that the pelagic Flood would have caused some melting of the ice sheets wherever the water of the Flood came into contact with them. Ice at atmospheric pressure melts at 0°C. At 300 atmospheres pressure, such as would be encountered under a two mile water column, ice melts at -2.32°C.[18] Meanwhile, deep ocean water is typically within a few degrees of 4°C.[19] Deep ocean water makes up most of the bulk of the oceans today and is expected to best approximate the water of the Flood which would have come in contact with the ice sheets. Thus the Flood-ocean is expected to have melted the ice sheets wherever it came in contact with them. The rate of melting would depend on the actual temperature of the Flood water at a given time and location, in addition to other factors, of course, but melting is expected in any event.

The next question which arises in this context is whether it would be the top or the bottom of an ice sheet which would be in contact with the water of the Flood. The depth of the Flood specified by the pelagic Flood model is considerably greater than the average elevation of any of the polar ice sheets today. Thus these ice sheets must either have been submerged by the Flood or they must have floated upon it. If an ice sheet were to float then clearly it would be the underside of the sheet which would be melted by the Flood water. If, on the other hand, an ice sheet were to remain submerged during the Flood, then the top of the sheet would be melted back.

It is well known that ice floats in water. Even the highly pressurized ice at the bottom of a large ice sheet will float since it is less dense than water. But many ice sheets are observed to be frozen to their beds at present. This is like having a block of wood glued to the bottom of a pail. If you fill the pail with water, the block of wood will experience a buoyant force tending to make it float. If the glue is weak the block will break loose as the water rises and it will float. But if the glue is strong enough the block will stay glued to the bottom and be submerged.

Whether an ice sheet would float or remain under water during the Flood depends on whether the buoyant force on that particular ice sheet was strong enough to overcome the "glue"—in this case, the tensile strength of the ice itself—holding it to its bed. Clearly, we would like to be able to predict which ice sheets would break loose and float and which would remain frozen to their beds so we can predict whether a given ice sheet would have been melted on its topside or its underside.

To Float or Not to Float

Whether an ice sheet would float or not can be calculated using the fundamental laws of physics and the measured properties of glacier ice. Figure 1 shows the basic problem. If the force of buoyancy, Fb, acting on an ice column due to the presence of water is greater than the weight of the ice column, Fg, plus the force due to the ultimate tensile strength of the ice, Ft, holding it to its bed, then the ice will break away from the bed and float. Otherwise it will stay submerged.

Figure 1: Forces acting on an ice column of mass m frozen to bedrock under water.

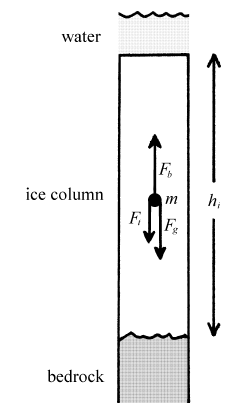
The force of buoyancy on the ice is, according to Archimedes' principle, just equal to the weight of the displaced water. Let ρw represent the density of sea water, Vi represent the volume of the column of ice shown, and g represent the acceleration due to gravity. Then

Let ρi represent the density of the ice. Then

At the breaking point the buoyant force will be equal to the sum of the other two forces.

Substituting for Fb and Fg gives

Rearranging gives

Let the cross-sectional area of the column of ice be Ai and its height be hi. Then

Solving these last two equations for hi yields the desired result.

Substituting values for the quantities on the right side of this equation will give us the critical height of a column of ice. An ice sheet which is on average thicker than this critical height will be expected to break away from its bed and float, while thinner ice sheets will remain frozen to their beds and be submerged.

The quantity Ft / (Ai g) (the ultimate tensile strength of ice) has been measured by a number of investigators. W. F. Weeks found a value of 29.6±8.5 kg/cm2 for fresh-water ice produced in the laboratory.[20] Butkovich found values within this range for measurements on glacier ice[21] as did Langleben and Pounder for sea ice[22].

The density of ocean water varies slightly with temperature, salinity, and pressure. For the present case a value for ρw of about 1033 kg/m3 seems most appropriate.[23]

The density of ice varies with depth in an ice sheet. Icebergs are pieces of ice sheets which have broken off into the ocean. They should provide a representative value of ice density for ice sheet ice. Pickard and Emery give the density of iceberg ice as "about 900 kg/m3".[24] Given the large uncertainty in the ultimate tensile strength of ice cited above, this estimate should be adequate for the present calculation.

Substitution of these values into Equation 2 yields a critical height of about 2,200±600 meters (7,300±2,100 feet) for an ice sheet to break free of its bed due to buoyancy.

The Greenland and Antarctic Ice Sheets

The uncertainty in this quantity is, unfortunately, large. This hampers our ability to make clear-cut predictions for ice sheets having average thicknesses near 2,200 meters. Applying the usual rules from the branch of mathematics known as statistics to the calculated critical height and its uncertainty indicates that there is about a two in three chance the true critical height for ice sheets lies somewhere between 1,600 and 2,800 meters. Conversely, there is about a one in three chance it lies outside this range. But there is only about a five percent chance it lies outside the range 1,000 to 3,400 meters, and less than a half of one percent chance it lies outside the range 400 to 4,000 meters. The further away the average thickness of an ice sheet is from the calculated critical height, the more confidently we can predict whether that ice sheet would have floated or remained submerged during the Flood.

Unfortunately (though not terribly so, as we will see below) the average thicknesses of the largest (and most intensely studied) polar ice sheets—the Greenland and Antarctic ice sheets—appear to be comparable to the critical height. I have not been able to find a figure for the average thickness in either case, and it may be that the average thicknesses are not yet known. But the Greenland ice sheet was found to be 2,037 meters thick when drilled through to bedrock at Dye 3, and the Antarctic ice sheet was found to be 2,164 meters thick when drilled through to bedrock at Byrd Station. Both thinner and thicker sections than these exist within these ice sheets, so we cannot just treat these point measurements as averages, of course. The borehole at Camp Century, Greenland, penetrated to bedrock in just 1,365 meters, for example, and Shoji and Langway claim that "the maximum thickness of an inland polar ice sheet is between 3000 m and 4000 m".[25] But it is clear, in any case, that the average thicknesses are not sufficiently distinct from our calculated critical height of 2,200±600 meters to allow an assured prediction for these two very large ice sheets.

But ice cores have also been taken from a few smaller ice sheets, and here, fortunately, a solid prediction is possible.

The Devon Island Ice Cap

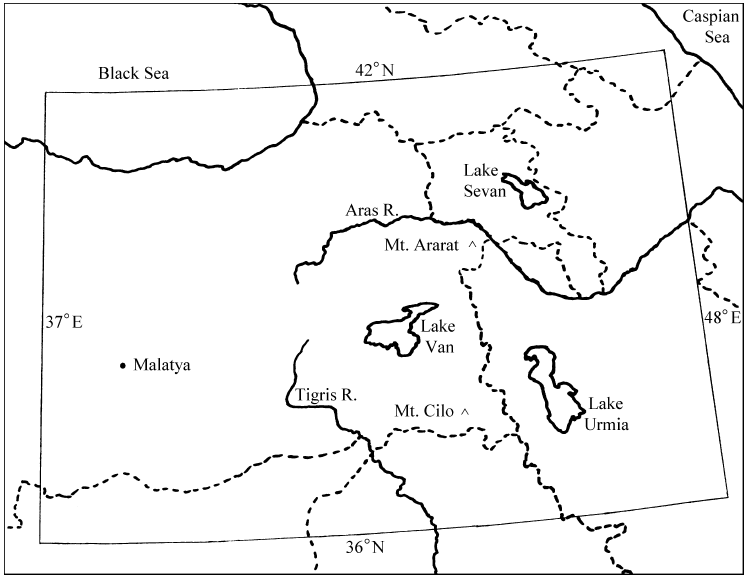
The most intensely studied smaller ice sheet appears to be an ice cap on Devon Island in Northern Canada. (See Figure 2.) This is the only small ice sheet which I have been able to find so far for which chronological data adequate to the present purpose exist. It is also well suited to the present investigation in that its oldest ice dates much further back than 5,500 years ago.

Figure 2: Map showing locations of bore hole D72 on Devon Island and Camp Century on Greenland.

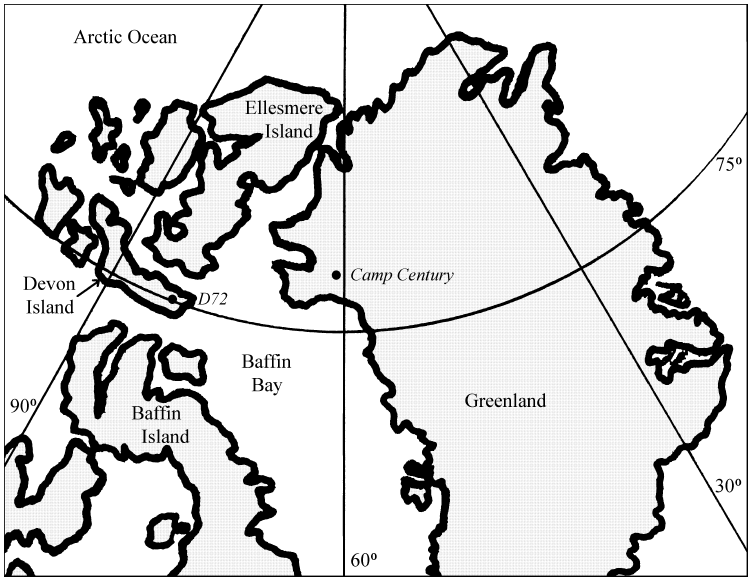
This "small" ice cap on Devon Island is still quite massive. It covers an area of nearly four million acres (15,600 km2).[26] Two bore holes, D72 and D73, were drilled through the Devon Island ice cap to bedrock. D72, drilled in 1972, was 298.9 meters deep. D73 was drilled in 1973 and was 299.4 meters deep. Patterson reports that "measured ice thicknesses are in the range 200 to 1,000 m".[27] Thus, an average thickness much less than the critical height of 2,200±600 m calculated above is indicated, and we may confidently predict that the Devon Island ice cap would have remained frozen to its bed throughout the pelagic Flood.

This leads immediately to a second prediction. The elevation of the ice does not exceed 2,000 meters (6,500 feet) at present. The pelagic Flood model specifies a water depth at least a mile in excess of this elevation for about half a year.[28] Thus, the ice must have been submerged under about a mile of ocean water for about half a year. Significant meltback of the top side of the ice cap during the Flood is predicted.

Is there any evidence confirming these predictions? Indeed there is.

Evidence #1

That the Devon Island ice cap remained frozen to its bed 3500 B.C. is directly supported by the ice cores, D72 and D73, taken from the ice cap. From study of these cores glaciologists Koerner and Fisher concluded "the ice has almost certainly been frozen to its bed throughout its history".[29]

Evidence #2

If the top of the ice cap was melted back significantly during the Flood as predicted and new ice began to accumulate again after the Flood, then the ice cores which were taken from the ice cap might be expected to show a discontinuity of some sort between the old pre-Flood ice and the new post-Flood ice.

A discontinuity in the comparison of measured oxygen isotope ratios in the two cores shows up 13 meters above the base of the Devon Island cores. Paterson et al. reported that:[30]

The [oxygen] isotope profiles from the two boreholes closely resemble each other except near the base of the ice. The correlation between 50-yr mean δ [oxygen isotope ratio] values is 0.965 between the surface and 13 m above the bed, but only 0.449 between 13 and 5 m.

The two cores were drilled only 27 meters apart. Effort was made to situate them on the same ice flow line. Thus their oxygen isotope ratios should closely resemble one another. The fact that they do not do so below 13 meters above bedrock is clear evidence of some sort of disturbance.

I suggest that the upper sections of core which show good correlation represent post-Flood ice, while the lower 13 meters which show poor correlation between the two cores is pre-Flood ice. Some of the loss of correlation in the bottom ice may be due to perturbations in ice flow over an uneven bed, especially in the lowest few meters. But I suggest the principle reason the sections from the two cores between 13 and 5 meters show poor correlation is because the pre-Flood flow lines were different than the presently observed flow lines. This would mean that the ice in these lower sections may have originated from quite different places on the surface of the pre-Flood ice sheet. In that case the overall trends in oxygen isotope ratios would be expected to be similar (as is observed) but detailed correlation would not be expected.

Evidence #3

If the Devon Island ice cap was melted back at the time of the Flood and the Flood happened 3520±21 B.C., then the date of the oldest post-Flood ice should be within ice core dating uncertainties of 3520±21 B.C.

We have just seen that the expected discontinuity between pre-Flood and post-Flood ice is at a depth of 13 meters above the bedrock. Thus, the oldest post-Flood ice will come from this depth. The date of ice at this depth can be determined in a fairly straightforward manner from the stratigraphy of the ice itself. The chronological data in this instance are the measured annual layer thicknesses at various depths along the borehole. These are determined using the ice cores which were taken from the ice sheet. Seasonal variations in measured microparticle (i.e., dust) concentrations are used as the means of distinguishing one year from the next—annual snow layers soon lose all visual distinctiveness because of compression by overlying layers and conversion to solid ice.

It would be very nice if we had a continuous series of microparticle measurements from the top of the ice core to its base. In that case we would be able to simply count the annual layers of ice from the top down to 13 meters above bedrock. This would provide the most simple method of ascertaining the date of the ice at 13 meters. However, while this method provides for simple chronology, it requires a very large effort in the laboratory.

To discern yearly oscillations in microparticle concentration one needs to make separate measurements on at least two samples from each annual layer. This means that to date back to five thousand years ago by counting annual microparticle oscillations, the microparticle concentrations of at least ten thousand samples of ice would need to be measured in the laboratory. (In actual practice, of course, one would want to measure four or more samples per year to adequately resolve the annual signal.)

Rather than go to the enormous amount of work and expense required to measure microparticle concentrations throughout an entire ice core, it is easier and quicker (though less accurate, of course) to measure microparticle concentrations in detail at a relatively small number of depths along the core and interpolate these measured values. This is what has been done with the Devon Island cores.

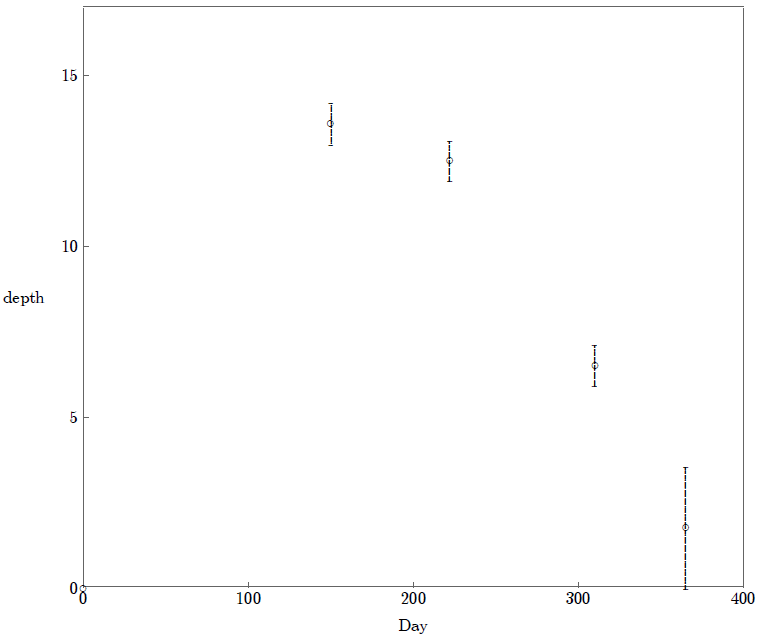
Figure 3 shows a graph of measured annual layer thicknesses versus depth for the Devon Island ice core, D72. I have obtained the data for this graph (see Table 1), evidently due to Fisher and Koerner, from a paper by Reeh and Patterson.[31] I have interpolated the measured data points with straight lines, and linearly extrapolated the last two points to the 13 meter-above-bedrock depth.

Figure 3: Annual layer thickness versus ice-equivalent depth in D72 ice core.

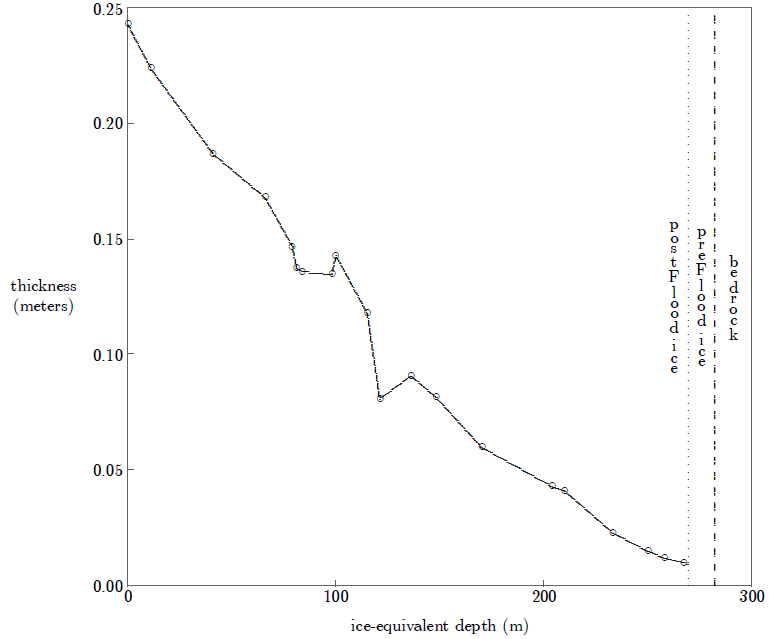
Table 1: Measured annual layer thicknesses at various ice-equivalent depths from core D72. Depth and thickness are both in meters.

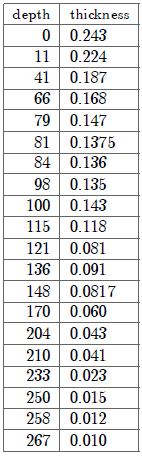
The total length of ice and snow in the D72 core was 298.9 meters, as mentioned above. For modeling purposes it is common to work with "ice-equivalent" depth rather than measured depth. This is the depth along the ice core one would have measured if the snow at the top of the ice sheet had been compressed into ice. Such theoretical compression shortens the D72 core by 17 meters.[32] Ice-equivalent depth was used in Figure 3 because ice-equivalent depth was used in the data table from which the plotted data were obtained.

The mathematical transformation from measured depth to ice-equivalent depth does not compress the bottom of the ice sheet, which is already made up of ice. Only the upper layers are compressed. Consequently, 13 meters above the bedrock is still the point corresponding to the oldest post-Flood ice. The ice-equivalent depth of this point is (298.9 - 17 - 13 =) 269 meters.

The elapsed time between the top of the ice sheet and 269 meters ice-equivalent depth is found by calculating the integral:

where λ is the measured annual thickness at depth h.

This integral can be calculated in the straight line interpolation case shown in Figure 3 by computing the sum:

In this equation the hi's and λi's are the coordinates of the twenty points shown in Figure 3. The points are enumerated with i=1 at the top of the ice sheet. h21 is the ice-equivalent depth of the oldest post-Flood ice (i.e., 269 meters), and λ21 is obtained by linear extrapolation of points 19 and 20 to this depth.

This sum yields 5,401 years. Subtracting the date of drilling (1972) yields 3429 B.C. as the best estimate of the 13 meter-above-bedrock ice. This is only 91 years different than the Biblical date for the Flood (i.e., 3520±21 B.C.). While it is difficult to assess the uncertainty in this calculated ice core date arising from the interpolations and extrapolation used, it must certainly be greater than a century. Thus, the oldest post-Flood ice is found to be within ice core dating uncertainties of the Biblical date for the Flood as required.

Evidence #4

According to conventional secular scientific wisdom (which presently makes no allowance for Noah's Flood) the climate at Devon Island (as also elsewhere) should have been more or less uniform since the last ice age some ten thousand years ago. The accumulation of snow on Devon Island, though fluctuating from year to year, is expected to have been approximately constant on average with no significant long term trend. The temperature, too, should have been roughly constant on average. And since nothing (like Noah's Flood) is known to secular science which might have upset the simple year-by-year accumulation and loss of ice at Devon Island, conventional wisdom says the Devon Island ice cap should be able to be successfully modeled assuming steady state conditions within the ice cap today.

But if the Devon Island ice cap experienced significant meltback at the time of the Flood, then efforts to mathematically model the present dimensional parameters of the ice cap (i.e., its height, annual layer thicknesses, horizontal extent, etc.) which assume steady state (and thereby ignore this meltback) should not succeed.

Paterson and Waddington applied a steady state model to the Devon Island ice core data in 1984 and found, much to their surprise, that it didn't work. They concluded "the steady state assumption has broken down".[33]

Because the Devon Island ice cap was significantly melted back by the Flood in the relatively recent past, steady state assumptions will not work when modeling this ice cap.

Evidence #5

Normally the total thickness of a mature ice cap remains roughly constant from year to year. This results from the fact that old ice is squeezed out the sides of the ice cap, by the weight of the overlying ice and snow, at the same rate as new snow accumulates on top each year. But if a significant amount of snow and ice is removed from the top side of an ice cap then this normal balance will be lost. Flow of old ice out the sides will slow down because there is no longer enough weight to squeeze the ice out as previously. Consequently, the ice cap will begin to thicken again. Thickening will continue until the old equilibrium thickness has been regained.

If the Devon Island ice cap experienced significant meltback at the time of the Flood, then thickening of the ice cap due to regrowth since the Flood is expected.

Evidence for thickening comes from oxygen isotope analyses of the ice. Oxygen isotope analysis, mentioned already above in connection with the 13 meter discontinuity, is a standard tool of science used more or less routinely in the study of ice cores. The ratios of isotopes of oxygen (oxygen atoms of differing masses) are measured in the ice. This ratio is sensitive to changes in temperature and also to changes in the altitude at which the snow was deposited. If the Devon Island ice cap was thinner in the past, then snow would have been accumulating on the ice sheet at a lower altitude in the past. In that case the oxygen isotope ratio should be higher in the older ice than it is in the modern ice.

In point of fact the measured oxygen isotope ratios graph shows a distinct linear trend from higher to lower values from just above the 13 meter discontinuity to the present as is shown in Figure 4.[34]

Figure 4: Oxygen isotope ratios measured versus depth in the Devon Island ice cap. Scale at left is δO18 in parts per thousand. (Data are from Paterson et al. See footnote 34 for reference.)

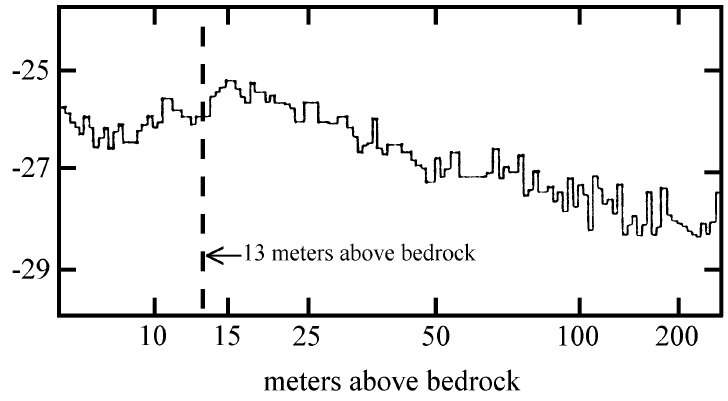
Interestingly, this trend furnishes us with a quantitative estimate of how much the Devon Island ice cap was melted back by the Flood. Paterson et al. observe, "the additional 1.6‰ [per thousand change in the measured oxygen isotope ratio] at Devon Island would correspond to a thickness change of about 250 m".[35] Since the ice cap is currently 300 meters thick at the drill site, this suggests that only about 50 meters of the original ice cap remained following the Flood. (This original 50 meters has thinned to just 13 meters today due to the weight of the overlying ice.) That is, in excess of 80% of the pre-Flood ice cap was melted away by the waters of the Flood.

As an interesting aside, the upper 250 meters of the ice cap represent about 3,000 years of accumulation today. Thus it is possible to estimate that about 3,000 years of pre-Flood chronology were lost from the Devon Island ice cap at the time of the Flood. This implies that a 3,000 year hiatus exists at the 13 meter-above-bedrock discontinuity in the D72 ice core chronology. This prediction could possibly be tested by radiocarbon measurements on ice taken above and below the 13 meter discontinuity.

Evidence #6

If the Devon Island ice cap experienced significant meltback at the time of the Flood, then the measured annual layer thicknesses of ice in the D72 core should be found to be increasingly too thick with depth relative to steady state expectations.

To see this, consider the time development of an ice sheet following a meltback. (See Figure 5.) For the sake of simplicity, assume the ice sheet receives just one foot of snow each year and that it has been melted back to bedrock. (The depth and time scale are unimportant here; it is only the principles which are important.) In the first year after the meltback the snow will accumulate to one foot depth above bedrock. In the second year another foot of snow will accumulate. This will weigh down the first year's accumulation and compress it somewhat. For the sake of simplicity once again, assume that each layer compresses each year to one half the thickness it had the year before due to the weight of the overlying snow. (In real life thinning occurs by compression near the top, giving way to horizontal flow of ice as one moves deeper in the ice, but such details are unimportant here.) If this is allowed to go on indefinitely simple mathematics shows that this hypothetical "ice sheet" will achieve a steady state thickness of two feet.

Figure 5: Simplified illustration of the growth of an ice sheet showing how bottom layers thin while upper layers retain their same thickness as the ice sheet ages.

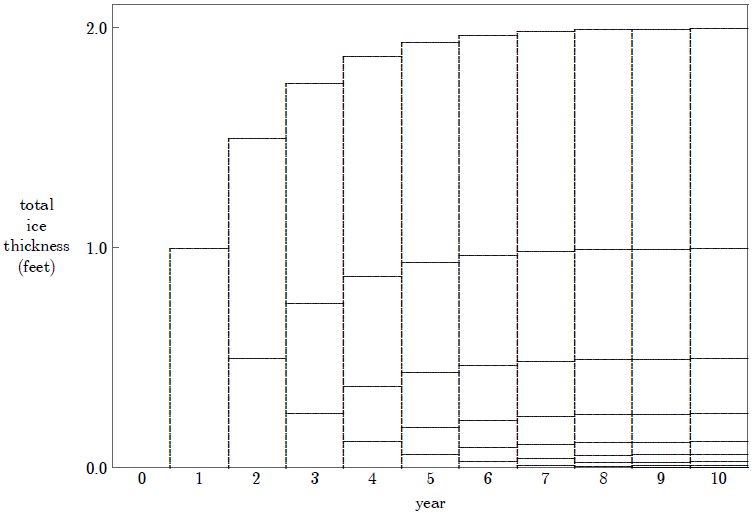
Figure 5 shows the approach to steady state for the first ten years in this case. Compare the ice sheet layer thicknesses after four and ten years. Notice that the upper layer thicknesses are identical—the only difference is that they are at a lower altitude at four years than they are at ten. In contrast to this, however, the bottom layers in the four-year-old ice sheet are much thicker than those in the ten-year-old ice sheet.

As an ice sheet ages toward steady state its top layers show no change in thickness, but its bottom layers grow thinner and thinner. If one mistakenly assumes steady state in an ice sheet which is growing and has not yet come to steady state, they will find that the upper layers are the expected thickness, but the lower layers are increasingly too thick with depth.

Paterson and Waddington were the first to observe this effect in the Devon Island ice cap.[36] Their observation resulted when they applied the steady state model, mentioned above, to the ice cap.

Reeh and Paterson subsequently applied a more sophisticated steady state model to the Devon Island ice cap, but they arrived at the same result.[37]

Calculated layer thicknesses are compared with the measured ones… Down to a depth of 136 m, where the ice is about 900 years old, calculated values are within 10% of the measurements, except for one point. Below this, the measured thicknesses exceed the calculated ones and their ratio increases with depth. At 267 m, for example, the measured layer thickness is six times the calculated one.

Because approximately 80% of the Devon Island ice cap was melted back by the Flood only 5,500 years ago, it has not yet achieved steady state. Consequently its lowest annual layers are much too thick relative to steady state expectations.

Evidence #7

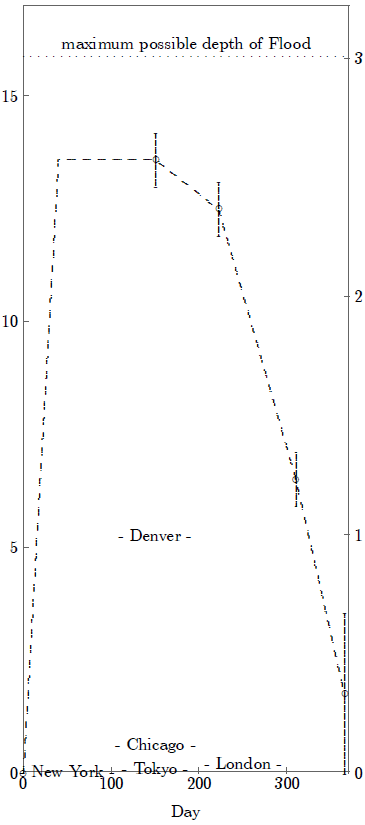
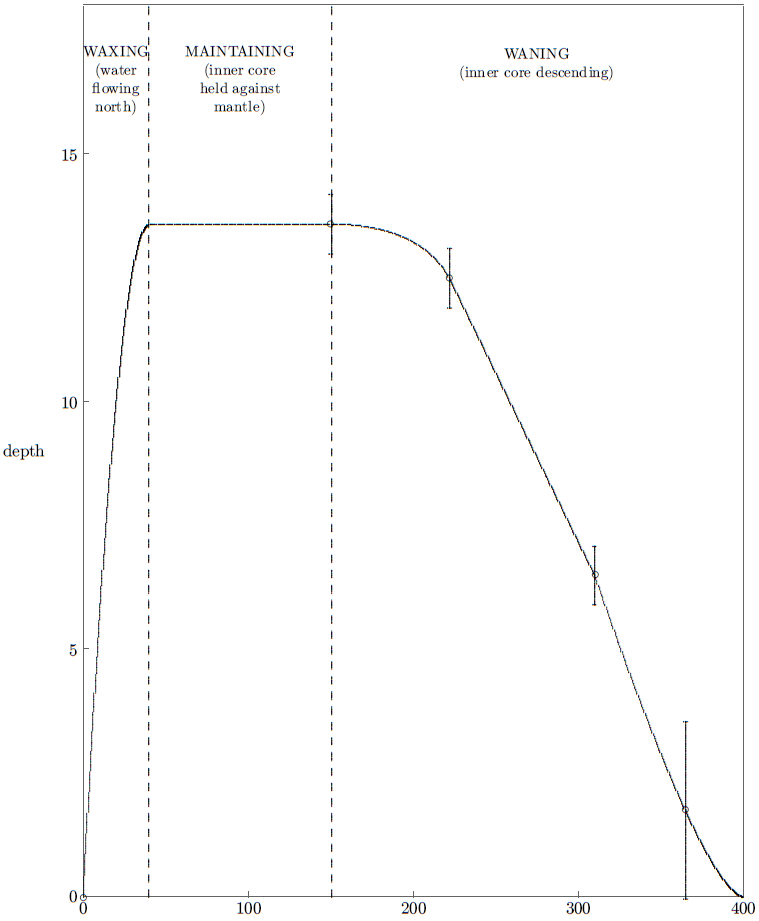
If the Devon Island ice cap was melted back by the pelagic Flood 3520±21 B.C., then a non-steady-state model which allows the possibility that the ice cap may have been a different thickness in the past should work well. It should show a minimum total thickness of the ice cap about 5,500 years ago, and steadily increasing total thickness since that time.

The solid and dashed line in Figure 6 shows the total ice cap thickness versus time calculated by such a model by Reeh.[38] Reeh was unaware of the 3,000 missing years at the 13 meter-above-bedrock discontinuity, so he made no allowance for it in his model. This means we cannot expect Reeh's model to get the absolute thickness correct for times prior to or relatively soon after 5,500 years ago. (The dashed line prior to about 6,000 years is included in Reeh's original graph. It indicates that Reeh did not feel confident about this portion of his model in any event. I have used a dotted line to indicate what Reeh's model would probably have shown if allowance had been made for these missing 3,000 years.) But Reeh's model does clearly show the minimum thickness at 5,500 years ago, and the steadily increasing ice cap thickness since that time, and even just the reproduction of these features must be regarded as truly remarkable and a major confirmation of the pelagic Flood model.

Figure 6: Total ice cap thickness at Devon Island versus time calculated by N. Reeh using non-steady-state model (solid and dashed line). Dotted line is by G. E. Aardsma and is heuristic only.
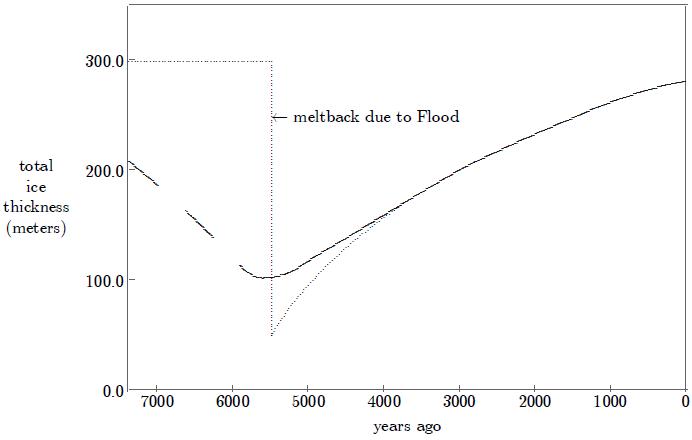
Going Further

These seven evidences doubtless do not exhaust the possibilities, but it is a little difficult to imagine what further evidence one might need. The data from Devon Island paint a picture of an ice cap frozen to its bed, suddenly melted back from the top to a mere 20% its former thickness about 5,500 years ago, thereafter resuming growth toward a new steady state balance. While this picture is most unexpected and surprising within the presently established secular view of earth history, it is predicted by the pelagic Flood model.

But let me take the argument one step further.

The Flood at Camp Century, Greenland

Across Baffin Bay from Devon Island (Figure 2, above) is Greenland, with its enormous ice sheet, large enough to stretch from southern Texas to the Canadian border, and wide enough to cover the five states in between. On the northwestern side of Greenland the first bore hole to ever penetrate that ice sheet was drilled at a site known as Camp Century. Less than 400 miles separate Camp Century and Devon Island. If the pelagic Flood caused such a dramatic effect at Devon Island, it surely must also have been felt at Camp Century.

The Greenland ice sheet, like the Devon Island ice cap, is frozen to its bed at present; the temperature of the ice at the base of the Camp Century bore hole is -13°C.[39] We have already seen that it is not possible to predict whether the Greenland ice sheet would have broken from its bed or not due to the buoyant force of the Flood waters. But we can confidently state that either it remained frozen to its bed with a resulting meltback similar to that at Devon Island, or it broke loose, in which case it would necessarily experience severe melting of its underside.

The Camp Century core does not show evidence of severe meltback from the top. For example, in contrast to Devon Island, the measured oxygen isotope ratios at Camp Century do not show any trend indicative of increasing altitude of snow deposition. We may, on this basis, confidently assert that the Greenland ice sheet did break loose from its bed and float on the waters of the Flood. That being the case, we may predict that the bottom ice at Camp Century will show signs of having once been melted.

The evidence of bottom melting at Camp Century is about as clear as the evidence of top melting at Devon Island. Herron and Langway summarize what has been found at the base of the Camp Century ice core as follows:[40]

The Camp Century, Greenland, ice core was recovered from a bore hole which extended 1375 m from the surface of the Greenland ice sheet to the ice/sub-ice interface. The bottom 15.7 m of the core contain over 300 alternating bands of clear and debris-laden ice.
and
The basal zone of this ice core contains numerous silt bands and small pebbles underlain by several meters of a till-like sub-ice material.

Contrast this with the basal ice at Devon Island:[41]

The ice-bedrock contact is sharp…

Detailed study of the Camp Century core revealed that only melting of the bottom ice and refreezing appeared able to explain the bottom 15.7 meters of the core:[42]

Both the low gas concentration in the debris-laden zone and the argon enrichment may be explained by the downward diffusion of gases from bubbly glacier ice into an originally bubble-free zone of refrozen debris-laden ice.

The evidence for melting and refreezing of the bottom ice at Camp Century is clear.

Unfortunately, there is no immediately obvious way to physically date when this melting and refreezing took place. But it is enough, for the time being at least, to simply note that the prediction of the pelagic Flood model that the bottom ice at Camp Century in Greenland would show signs of having once been melted also succeeds.

Conclusion

What is the likelihood of the pelagic Flood model successfully predicting such dramatic effects on these Arctic ice sheets if this model is not correct? If the bottom ice at Camp Century was not melted by the pelagic Flood, then what did melt it? If the Devon Island ice cap was not melted back from the top by the Flood, then what did cause the 80% meltback of this ice cap? Why should the top of the Devon Island ice cap be melted, while it was the bottom of the Greenland ice sheet which was melted? Why should the date of the meltback at Devon Island be synchronous with the date of the 500 times oversized annual layer at Elk Lake, and the dates of both of these events be indistinguishable from the date of Noah's Flood which Biblical chronology specifies? There is only one such oversized annual layer in ten thousand annual layers at Elk Lake; what is the probability it should have occurred at just the right date for the Flood? There is evidence of only one meltback in at least ten thousand years of ice at Devon Island; what are the chances it would date to just the time of the Flood?

The pelagic Flood model is clearly confirmed by the Devon Island and Greenland ice sheet data. In consequence the 3520±21 B.C. date for Noah's Flood calculated by the new Biblical chronology is also confirmed. This is the principal result.

A second, rather remarkable result follows immediately on the heels of this first one, however. We can now say that we know when Noah's Flood happened in history, and we can now point to several dramatic archaeological and geological effects of Noah's Flood in the real world. This is just another way of saying that Noah's Flood has been found.

The fact that Noah's Flood has been found falsifies the reigning theory within secular academia that Noah's Flood is but a myth. Please note that myths do not terminate whole, real-life civilizations, they do not leave sedimentary deposits 500 times thicker than normal at the bottom of real lakes, they do not melt very real ice sheets of enormous extent in polar regions of the real world, and they most especially don't do such things all at the same, specified time. Noah's Flood is clearly not a myth—it is sober history.

The fact that Noah's Flood has been found to have been geologically active in northern Canada and Greenland as well as having had a pronounced archaeological effect in the Middle East shows clearly that the Flood was not a mere local phenomenon.

And the facts that the Arctic ice sheets predate Noah's Flood and that they were merely melted back from above or below rather than entirely demolished by the Flood falsify the cataclysmic Flood model.

Noah's Flood has been found, and it has been found to be neither local nor cataclysmic.


When I say that Noah's Flood has been found I do not mean to imply that research on Noah's Flood is now complete. In many ways it is just beginning. As mentioned last issue,[43] our understanding of the physical behavior of Noah's Flood is still incomplete. Specifically, how the water of the Flood was caused to rise several miles above the level of the present-day oceans and remain there for a significant fraction of a year is still unknown. Additionally, the interrelated question of where all the water for the Flood came from and where it all went has not yet been resolved within the pelagic Flood model. So there is still much work to do and much to be learned. But the fact that the Flood has been found in earth history can no longer be reasonably disputed; and the date of the Flood—a date of great importance to the process of correctly harmonizing the Bible and secular studies—is, at long last, settled. ◇

Biblical Chronology 101

Is the Flood Missing at Oyster Pond?

David Neev of the Geological Society of Israel and K. O. Emery of the Woods Hole Oceanographic Institution in Massachusetts recently coauthored a book purporting to give the geological, climatological, and archaeological background to the Biblical accounts of the destructions at Sodom and Gomorrah and at Jericho.[44] My assessment is that they have failed rather badly in their purpose—an inevitable outcome of having given absolute chronology almost no attention—but that is another matter entirely. What I wish to discuss here, for its pedagogical value, is a claim found within their book. The claim is the following (square brackets indicate amplification by me):[45]

Confirmation of the absence of a world-encircling flood [i.e., Noah's Flood] during Late Holocene [i.e., anywhere near the time it is usually expected] is provided by studies of sediments in other lakes of the earth—for example, a coastal lake of Late Pleistocene glacial origin in Massachusetts in the United States, where flora, fauna [i.e., plant and animal life], and δ13C and δ18O [i.e., carbon and oxygen isotope ratios] show no changes that could have been expected from intrusion of seawater at the biblical date of Noah's Flood (Emery, 1969).

This claim is somewhat interesting in that it is quite unusual anymore to find a scientific work even pretending that Noah's Flood should be taken seriously enough to deserve evaluation relative to real-life data—so badly lost is modern science with respect to Noah's Flood. But what really captured my attention was that this is a claim that lake sediments from around the world prove a global Flood to be false. My recent investigation of Elk Lake, Minnesota, revealed exactly the opposite.[46] There the evidence in support of a global Flood was found to be really quite impressive. What gives?

The "(Emery, 1969)" reference is to a book entitled A Coastal Pond: Studied by Oceanographic Methods.[47] It is a slender little book, packed with scientific data of all sorts regarding Oyster Pond in Massachusetts. It contains, for example, graphs and discussion on the rate of escape of methane bubbles from pond sediments. If you find abstract scientific measurements stimulating, then this is the book for you. But if you are enquiring seriously into the historicity of Noah's Flood, I recommend you look elsewhere—I quickly found that this little book contains nothing to allow an intelligent conclusion on that particular question. Worse yet, Oyster Pond hardly recommends itself even for investigation of the question.

Recall that the major thing which recommended Elk Lake was the fact that its bottom sediments showed clear annual layering. These layers showed that the sediments had not been mixed (by fish or clams or worms) and they permitted a detailed chronology of the sediments to be worked out. That is, we could be confident that whatever Noah's Flood had done to the sediments at Elk Lake had been preserved, rather than mixed together with the sediments from before or after the Flood. Furthermore, we could be reasonably confident we would be able to locate the portion of the sediment column which should correspond to the Flood because the sediments themselves provided a reasonable chronology.

This nearly essential property—annually layered sediments—does not exist at Oyster Pond.

I would not go so far as to say that Neev and Emery's claim for Oyster Pond is intrinsically impossible, but I do want to point out that the substantiation of their claim demands that somebody have invested a prodigious amount of time and money in the project—much more even than was expended by the many researchers who labored over the Elk Lake sediments. Obviously, the most basic requirement, if one wishes to show that Noah's Flood is not represented at Oyster Pond, is an adequate chronology of the pond sediments, so one might tell in which portion of the thirteen meters of sediment at the bottom of the pond one should expect to find evidence of the Flood. In the absence of annual layering, establishing such a chronology is a major undertaking. (I would wish any scientist about to embark on such a project: abundant funding, good luck, and long life—they will likely need all three.) Unfortunately, there is no indication Neev or Emery or anyone else has done anything approaching the necessary work to meet even this most basic requirement.

What, quantitatively, would Noah's Flood have done to the "flora, fauna, and δ13C and δ18O" records at Oyster Pond? Neev and Emery provide no answer. But if Neev and Emery have made no quantitative estimate of the probable effects of Noah's Flood on these parameters at Oyster Pond, how can they conclude those effects are absent there? And where might we look to find their measurements of flora or fauna or δ13C or δ18O versus time at Oyster Pond? There is a low resolution pollen count versus depth of sediment graph, with two uncalibrated radiocarbon dates providing the only chronological indicators in a span of more than ten thousand years in "(Emery, 1969)"[48], but this is woefully inadequate to the present purpose. Beyond this I have been unable to find anything even remotely to the point in "(Emery, 1969)".

I conclude that Neev and Emery's claim that the Flood is absent at Oyster Pond is, at the very least, premature—they have written a conclusion to an experiment which they have not yet performed. I am prepared to accept that Oyster Pond may have the potential of making some contribution to our understanding of Noah's Flood, but there seems to me no way of avoiding the fact that a whole lot of measurements must be made before it can make that contribution.


Prejudice is rampant in academic circles at present wherever Biblical historicity is concerned. Many otherwise capable researchers and scholars are committing serious blunders because of it. Do not give any credence to their claims—demand to see the evidence. ◇

Readers Write

2 Chronicles 15:3–6

I have been asked on several occasions why the Bible is so completely silent about the millennium which has been lost from 1 Kings 6:1.[49] Why does the Bible provide no history to fill up this chronological gap?

There are a number of components to the answer to this question, but perhaps the most important is that the Bible isn't completely silent about this period. It is true that there is no deliberate historical narrative covering the 800 year interval between Samson and Samuel—just as there is none, for example, for roughly 400 years of the Israelites' stay in Egypt, and none for the centuries which separate the Old Testament from the New—but a number of allusions to this period do seem to appear within the Old Testament. I have previously mentioned Judges 18:30,[50] Deuteronomy 28:15–68 and 31:14–32:47,[51] and Psalm 78:56–64 in this regard.[52]

In the following letter Karl Wiensz points out that 2 Chronicles 15:3–6 seems also to refer to this 800 year period.


Dear Dr. Aardsma,

In my daily Bible reading this morning I came across a passage that caught my attention. I made a special trip to my pastor's house where all the issues of The Biblical Chronologist are kept. I quickly thumbed through all of the issues to see if you had made comment on it. You had not.

The passage is 2 Chronicles 15:1–7. The Holy Spirit came on the man Azariah to prophesy to King Asa. Verses 3 through 6 say [NIV]:

For a long time Israel was without the true God, without a priest to teach and without the law. But in their distress they turned to the LORD, the God of Israel, and sought him, and he was found by them. In those days it was not safe to travel about, for all the inhabitants of the lands were in great turmoil. One nation was being crushed by another and one city by another, because God was troubling them with every kind of distress."

I hope the relevancy of this passage to your premise is obvious. Azariah appears to be making reference not to the recent revolt against Rehoboam, but to an ancient revolt against God. Notice the length and intensity of Israel's condition. It does seem more severe than what is recorded in the Judges.

This passage reminded me of your citation of Psalm 78…

Karl Wiensz
Rickreall, OR


Dear Karl,

Your observation seems to me to be a good one, and very probably correct. Verses 5 and 6 resonate immediately with all we learn from archaeology of the Israelites' plight in the 800 years between Samson and Samuel. I hadn't thought of this passage in this regard, and nobody has previously pointed it out to me. Thank you so much for having done so.


Gerald E. Aardsma, Ph.D.
Loda, IL

The Biblical Chronologist is a bimonthly subscription newsletter about Biblical chronology. It is written and edited by Gerald E. Aardsma, a Ph.D. scientist (nuclear physics) with special background in radioisotopic dating methods such as radiocarbon. The Biblical Chronologist has a threefold purpose:

  1. to encourage, enrich, and strengthen the faith of conservative Christians through instruction in Biblical chronology,

  2. to foster informed, up-to-date, scholarly research in this vital field within the conservative Christian community, and

  3. to communicate current developments and discoveries in Biblical chronology in an easily understood manner.

An introductory packet containing three sample issues and a subscription order form is available for $9.95 US regardless of destination address. Send check or money order in US funds and request the "Intro Pack."

The Biblical Chronologist (ISSN 1081-762X) is published six times a year by Aardsma Research & Publishing, 412 N Mulberry, Loda, IL 60948-9651.

Copyright © 1997 by Aardsma Research & Publishing. Photocopying or reproduction strictly prohibited without written permission from the publisher.

Footnotes

  1. ^  Gerald E. Aardsma, "Noah's Flood at Elk Lake," The Biblical Chronologist 2.6 (November/December 1996): 8,10.

  2. ^  Gerald E. Aardsma, "Chronology of the Bible: 5000–3000 B.C.," The Biblical Chronologist 2.4 (July/August 1996): 2–3.

  3. ^  Gerald E. Aardsma, "The Depth of Noah's Flood," The Biblical Chronologist 3.3 (May/June 1997): 8.

  4. ^  Gerald E. Aardsma, "The Depth of Noah's Flood," The Biblical Chronologist 3.3 (May/June 1997): 1–10.

  5. ^  Hershel Shanks, "Is This Man a Biblical Archaeologist?" Biblical Archaeology Review 22.4 (July/August 1996): 62.

  6. ^  John C. Whitcomb, Jr. and Henry M. Morris, The Genesis Flood (Philadelphia: The Presbyterian and Reformed Publishing Company, 1961), 265.

  7. ^  Sir Leonard Woolley, Spadework in Archaeology (New York: Philosophical Library, 1953), 105-106. Arthur C. Custance, The Flood: Local or Global? (Grand Rapids: Zondervan, 1979).

  8. ^  Gerald E. Aardsma, "Research in Progress," The Biblical Chronologist 1.1 (January/February 1995): 6–7. Gerald E. Aardsma, "Research in Progress," The Biblical Chronologist 1.2 (March/April 1995): 6–8. Gerald E. Aardsma, "Research in Progress," The Biblical Chronologist 1.4 (July/August 1995): 6–10.

  9. ^  Gerald E. Aardsma, "Research in Progress," The Biblical Chronologist 2.4 (July/August 1996): 9–14.

  10. ^  Gerald E. Aardsma, "Noah's Flood at Elk Lake," The Biblical Chronologist 2.6 (November/December 1996): 1–13.

  11. ^  C. W. Ferguson, "Bristlecone Pine: Science and Esthetics," Science 159 (23 February 1968): 839–846.

  12. ^  C. W. Ferguson, Barbara Lawn, and H. N. Michael, "Prospects for the Extension of the Bristlecone Pine Chronology: Radiocarbon Analysis of H-84-1," Meteoritics Vol. 20, No. 2, Part 2 (30 June 1985): 415–421.

  13. ^  C. W. Ferguson, "Bristlecone Pine: Science and Esthetics," Science 159 (23 February 1968): 839.

  14. ^  Gerald E. Aardsma, "The Depth of Noah's Flood," The Biblical Chronologist 3.3 (May/June 1997): 10 (Figure 2).

  15. ^  Harold C. Fritts, "Bristlecone Pine in the White Mountains of California: Growth and Ring-Width Characteristics," Papers of the Laboratory of Tree-ring Research, Number 4 (Tucson: The University of Arizona Press, 1969), 18.

  16. ^  C. W. Ferguson, "Bristlecone Pine: Science and Esthetics," Science 159 (23 February 1968): 841.

  17. ^  The idea of a pre-Flood vapor canopy and consequent world-wide warm pre-Flood climate attaches to the cataclysmic Flood model only. (See: John C. Whitcomb, Jr. and Henry M. Morris, The Genesis Flood (Philadelphia: The Presbyterian and Reformed Publishing Company, 1961), 243–258.) Simple chronological considerations forbid such a scenario within the pelagic Flood model.

  18. ^   CRC Handbook of Chemistry and Physics 77th edition, section 6, page 15.

  19. ^  George L. Pickard and William J. Emery, Descriptive Physical Oceanography: an Introduction, 4th (SI) enlarged edition (New York: Pergamon Press, 1982), 34–43.

  20. ^  W. F. Weeks, "Tensile Strength of NaCl Ice," Journal of Glaciology 4.31 (1962): 46.

  21. ^  W. F. Weeks, "Tensile Strength of NaCl Ice," Journal of Glaciology 4.31 (1962): 34 (Table I).

  22. ^  M. P. Langleben and E. R. Pounder, "Arctic Sea Ice of Various Ages: I. Ultimate Strength," Journal of Glaciology 5 (1964): 95 (Table I).

  23. ^  George L. Pickard and William J. Emery, Descriptive Physical Oceanography: an Introduction, 4th (SI) enlarged edition (New York: Pergamon Press, 1982), 17–21.

  24. ^  George L. Pickard and William J. Emery, Descriptive Physical Oceanography: an Introduction, 4th (SI) enlarged edition (New York: Pergamon Press, 1982), 184.

  25. ^  H. Shoji and C. C. Langway, Jr., "Physical Property Reference Horizons," The Environmental Record in Glaciers and Ice Sheets, ed. H. Oeschger and C. C. Langway, Jr. (New York: John Wiley & Sons, 1989), 161–162.

  26. ^  W. S. B. Paterson, "Vertical Strain-rate Measurements in an Arctic Ice Cap and Deductions from Them," Journal of Glaciology 17.75 (1976): 4.

  27. ^  W. S. B. Paterson, "Vertical Strain-rate Measurements in an Arctic Ice Cap and Deductions from Them," Journal of Glaciology 17.75 (1976): 4.

  28. ^  Gerald E. Aardsma, "The Depth of Noah's Flood," The Biblical Chronologist 3.3 (May/June 1997): 10 (Figure 2).

  29. ^  R. M. Koerner and D. A. Fisher, "Discontinuous Flow, Ice Texture, and Dirt Content in the Basal Layers of the Devon Island Ice Cap," Journal of Glaciology 23.89 (1979): 218.

  30. ^  W. S. B. Paterson, R. M. Koerner, D. Fisher, S. J. Johnsen, H. B. Clausen, W. Dansgaard, P. Bucher, and H. Oeschger, "An Oxygen-isotope Climatic Record from the Devon Island Ice Cap, Arctic Canada," Nature 266 (7 April 1977): 509.

  31. ^  N. Reeh and W. S. B. Paterson, "Application of a Flow Model to the Ice-divide Region of Devon Island Ice Cap, Canada," Journal of Glaciology 34.116 (1988): 62, Table I.

  32. ^  N. Reeh and W. S. B. Paterson, "Application of a Flow Model to the Ice-divide Region of Devon Island Ice Cap, Canada," Journal of Glaciology 34.116 (1988): 56.

  33. ^  W. S. B. Paterson and E. D. Waddington, "Past Precipitation Rates Derived from Ice Core Measurements: Methods and Data Analysis," Reviews of Geophysics and Space Physics 22.2 (May 1984): 126.

  34. ^  The data for this figure are from W. S. B. Paterson, R. M. Koerner, D. Fisher, S. J. Johnsen, H. B. Clausen, W. Dansgaard, P. Bucher, and H. Oeschger, "An Oxygen-isotope Climatic Record from the Devon Island Ice Cap, Arctic Canada," Nature 266 (7 April 1977): 510.

  35. ^  W. S. B. Paterson, R. M. Koerner, D. Fisher, S. J. Johnsen, H. B. Clausen, W. Dansgaard, P. Bucher, and H. Oeschger, "An Oxygen-isotope Climatic Record from the Devon Island Ice Cap, Arctic Canada," Nature 266 (7 April 1977): 510.

  36. ^  W. S. B. Paterson and E. D. Waddington, "Past Precipitation Rates Derived from Ice Core Measurements: Methods and Data Analysis," Reviews of Geophysics and Space Physics 22.2 (May 1984): 126.

  37. ^  N. Reeh and W. S. B. Paterson, "Application of a Flow Model to the Ice-divide Region of Devon Island Ice Cap, Canada," Journal of Glaciology 34.116 (1988): 62.

  38. ^  N. Reeh, "Dating by Ice Flow Modeling: A Useful Tool or an Exercise in Applied Mathematics?" The Environmental Record in Glaciers and Ice Sheets, ed. H. Oeschger and C. C. Langway, Jr. (New York: John Wiley & Sons, 1989), 156.

  39. ^  Susan Herron and Chester C. Langway, Jr., "The Debris-laden Ice at the Bottom of the Greenland Ice Sheet," Journal of Glaciology 23.89 (1979): 194.

  40. ^  Susan Herron and Chester C. Langway, Jr., "The Debris-laden Ice at the Bottom of the Greenland Ice Sheet," Journal of Glaciology 23.89 (1979): 193.

  41. ^  R. M. Koerner and D. A. Fisher, "Discontinuous Flow, Ice Texture, and Dirt Content in the Basal Layers of the Devon Island Ice Cap," Journal of Glaciology 23.89 (1979): 211.

  42. ^  Susan Herron and Chester C. Langway, Jr., "The Debris-laden Ice at the Bottom of the Greenland Ice Sheet," Journal of Glaciology 23.89 (1979): 185.

  43. ^  Gerald E. Aardsma, "The Depth of Noah's Flood," The Biblical Chronologist 3.3 (May/June 1997): 9.

  44. ^  David Neev and K. O. Emery, The Destruction of Sodom, Gomorrah, and Jericho, (New York: Oxford University Press, 1995).

  45. ^  David Neev and K. O. Emery, The Destruction of Sodom, Gomorrah, and Jericho, (New York: Oxford University Press, 1995), 120.

  46. ^  Gerald E. Aardsma, "Noah's Flood at Elk Lake," The Biblical Chronologist 2.6 (November/December 1996): 1–13.

  47. ^  K. O. Emery, A Coastal Pond: Studied by Oceanographic Methods, (New York: Elsevier, 1969).

  48. ^  K. O. Emery, A Coastal Pond: Studied by Oceanographic Methods, (New York: Elsevier, 1969), 25 (Figure 15).

  49. ^  Gerald E. Aardsma, A New Approach to the Chronology of Biblical History from Abraham to Samuel, 2nd ed. (Loda IL: Aardsma Research and Publishing, 1993).

  50. ^  Gerald E. Aardsma, A New Approach to the Chronology of Biblical History from Abraham to Samuel, 2nd ed. (Loda IL: Aardsma Research and Publishing, 1993) 99.

  51. ^  Gerald E. Aardsma, "The Chronology of Egypt in Relation to the Bible: 3000–1000 B.C.," The Biblical Chronologist 2.2 (March/April 1996): 8.

  52. ^  Gerald E. Aardsma, "The Chronology of Egypt in Relation to the Bible: 3000–1000 B.C.," The Biblical Chronologist 2.2 (March/April 1996): 9.


Volume 3, Number 5September/October 1997

The Cause of Noah's Flood

William G. Dever[1]: Most Biblical scholars regard most of the stories in Genesis as myths.

Hershel Shanks[2]: It's true, I think, that the first 11 chapters of Genesis would be regarded as myths—the creation stories, the story of Noah and the flood …[3]


For the past several months I have been deeply immersed in an investigation of the physical cause of Noah's Flood. Nearly all else has been swept from my world as I have pursued this long-kept mystery—a fact which explains both the unusual, monolithic nature of this present issue of The Biblical Chronologist, and the small, stratified mound of correspondence in one corner of my office waiting silently, patiently, for excavation to begin.

As I now set about to communicate what I have found I am aware of several limitations. For one thing, my quest is not entirely complete. I would have liked several more weeks to tie up a few loose ends. But the publication deadline for this issue presses—I have already put it off longer than is strictly permissable. In consequence, you will need to regard the present article as an interim report on research still in progress rather than a final product.

How can I explain the other limitations I feel? I feel as if I have been tunneling through a previously impassible mountain range. I have been at it with pick and shovel for quite a spell. I have just now broken through the far side with my pick—daylight streams through a ragged hole. It is too small to squeeze through, but as I gaze about through it I see a bright, bounteous, unexplored country. Its features are foreign and some are wholly unexpected…. But I must go back. I have an appointment with my friends back at the entrance to the tunnel on the other side of the mountain and I must not be late. I must tell them what I have seen. I must bring them here. Will I be able to satisfy all of their questions? Will they be able to follow me back through the dark tunnels?

Apologia

Should we look for a physical cause of the Flood? Isn't it somewhat impious to do so?

Yes, we should look for a physical cause of the Flood, and no, it is not impious to do so. In point of fact, given the present climate of rampant unbelief of the Bible among learned men and women world-wide, it is impious for Christians not to do so. Let me explain.

Genesis does not represent the Flood of Noah as a mythical saga. It presents it as sober, real-life history. So when a man or a woman concludes that Noah's Flood is mythological, they have automatically also concluded that Genesis is not a reliable historical witness. But if the Bible's historical witness in Genesis cannot be trusted, what basis is there for supposing that its historical witness in the Gospel of John can be trusted? If the Bible says the Flood happened when in fact it never did, should we trust the Bible when it says the Resurrection happened?

It will not help to try to separate the Old Testament from the New either, as if the Old could be mistaken but the New still sound, for the New Testament also treats the Flood as real-life history. It reads, "And just as it happened in the days of Noah, so it shall be also in the days of the Son of Man: they were eating, they were drinking, they were marrying, they were being given in marriage, until the day that Noah entered into the ark, and the flood came and destroyed them all."[4]

If Noah's Flood is myth, then the New Testament as well as the Old cannot be trusted. Indeed, in that case, even Christ cannot be trusted (may it never be!) for those are is His words which we have just read above from Luke 17. He has then Himself mistaken a myth for real history. And how then can men and women be called to trust Him—to rest their eternal destiny in Him?

Is it not then the pious duty of every genuine Christian to exert themselves in whatever way they are able to show the historical factuality of Noah's Flood to the present, unbelieving generation?

As it turns out, there is no better way of doing this then by discovering the physical cause of the Flood. I will not try to explain why this is so here; it will, I hope, be abundantly clear by the time you have finished reading this article.

But I do not want my attempt to find the physical cause of the Flood to be misunderstood. I am a scientist and I will be bringing the tools of science to bear on this question as forcefully as I know how. But please do not suppose for even a moment that I am out to purge the Flood narrative of the supernatural by my effort to understand its physical cause. The Biblical narrative clearly portrays supernatural activity associated with the Flood, and I have no argument with the witness of the text. (Neither, for that matter, does true science, though many today, having imbibed deeply of the philosophical intoxicant called naturalism, would have us believe otherwise.) The timing of the Flood was clearly supernatural. The revelation of the impending judgment to Noah was clearly supernatural. Even the closing of the door of the ark was supernatural.[5] It would be folly, in my opinion, and a denial of the word of God to attempt to find a natural, physical cause underlying any of these things.

But the Flood narrative also involves much which is not supernatural. God could have supernaturally taken Noah, his family, and the animals out of the earth entirely, and returned them only after the Flood was all over if He had wanted to do so, but He chose rather that Noah should build a boat. God could have supernaturally zapped every unbelieving, unrepentant sinner in Noah's generation out of earthly existence to stand then and there before the judgment seat if He had wished to—leaving Noah and His family safely behind—but He chose rather to send a flood.

The natural and the supernatural are both there side by side. To deny either is to miss the truth. The supernatural is there that we might know that God is. The natural is there as a verifiable witness to what He has done.

It is this witness which is the object of my present effort to discover the physical cause of Noah's Flood.

Review

I have previously shown that the proper Biblical date for the Flood is 3520±21 B.C.[6] Archaeological data in the Near East reveal a widespread termination of civilization, extinguishing the Chalcolithic culture, synchronous with this Biblical date.[7] This is evidence of Noah's Flood in the Near East.

Sedimentary data from Elk Lake, Minnesota, reveal anomalously intense deposition in an ocean-like environment at the Biblical date of the Flood.[8] This is evidence of the Flood in North America.

This evidence instigates a view of the Flood as an essentially global ocean. The complete silence of the Biblical narrative regarding the sorts of phenomena normally associated with cataclysmic upheaval implies a non-cataclysmic, global ocean.[9] This view I have called the pelagic Flood model.[10]

The fact that the ark landed in the Ararat region implies that the water of the Flood stood several miles above present-day sea level.[11] The great depth of water involved is supportive of the pelagic Flood model, since almost all land would have been covered by water of this depth.[12] But the question of where so much water could have come from, and where it all went when the Flood was over, especially in the absence of large-scale tectonics, is immediately raised.[13]

The vast ice sheets of the Arctic testify to the presence of the Flood there at the Biblical date of the Flood. The Devon Island ice cap in northern Canada was severely melted back by the waters of the Flood near 3500 B.C., and the Greenland ice sheet was lifted free of its bed through buoyancy and its underside melted.[14]

The Antarctic Ice Sheet

But—surprise, surprise—the Antarctic ice sheet does not seem to show any signs of melting from above or below which might reasonably be ascribed to the Flood.

The Byrd Station core from the Antarctic ice sheet does show evidence of bottom melting, but this melting appears to be modern rather than from the time of the Flood.[15] To understand why this appears to be the case it is necessary to briefly discuss the behavior of air entrapped in glacier ice.

Glacier ice is usually formed from snow by compaction due to the weight of overlying snow. Much air exists in a volume of snow. When snow is compacted to ice, some of the air is squeezed out, but some of it remains trapped in the ice. Thus glacier ice normally contains numerous small air bubbles.

If the ice is melted, the air escapes from the meltwater. If this meltwater is refrozen, it produces air-free ice.

If this refrozen ice is in contact with the original glacier ice, air bubbles can be reintroduced into it. The air in the original ice can diffuse into the refrozen ice. This is a slow process, however.

In the Greenland ice sheet at Camp Century the bottom 15.7 meters were found to be laden with dust and rock debris, indicating significant melting and refreezing.[16] The air content of this refrozen ice is about half that of the overlying, normal, unmelted glacier ice. This implies that at least a few thousand years have elapsed since the melting process—that much time is required for that much air to diffuse back into the refrozen ice.

In the Antarctic ice sheet at Byrd Station only the bottom 4.83 meters are found to be laden with dust and rock debris, indicating melting and refreezing on a smaller scale than in the Greenland ice. And this time the bottom ice is "practically devoid of air".[17] This implies that the melting and refreezing process is of very recent origin in the Antarctic ice sheet. And, in fact, meltwater was encountered at the bottom of the Byrd Station drill hole during drilling, "clear evidence that the bottom of the ice sheet at this location is at the pressure-melting point".[18] (In contrast, the Greenland ice sheet at Camp Century is at -13°C, far removed from its pressure-melting point.[19]) Thus the bottom melting and refreezing at Byrd Station—the only evidence at Byrd Station I am aware of which might possibly be related to Noah's Flood—is clearly of recent origin. It is, therefore, not related to Noah's Flood, which we know took place 5500 years ago.

Implication

How is it possible to have a global, miles-deep Flood which leaves no trace at Byrd Station in Antarctica? Clearly, it is not possible. The implication is clear—Byrd Station did not experience the Flood; the Flood did not extend to Byrd Station.

This immediately reopens the discussion of the geographical extent of the Flood.

Global or ?

Unfortunately, the discussion of the geographical extent of the Flood has often been framed in terms of a false dichotomy. It has been presented as if the options are either "global" or "local". "Local" implies a very limited geographical extent, and much of the Biblical Flood account seems unintelligible within such a framework. But to conclude from the Biblical account that the Flood was not local does not logically yield the conclusion that the Flood was therefore global. It is true that the Flood was either "global" or "not global", but "not global" and "local" are not the same thing. Between the two extremes of "global" and "local" lies a spectrum of other possibilities.

We have previously seen that the Biblical narrative does not demand a global Flood if the narrative is understood as reporting Noah's observations, rather than God's.[20] The text says, for example, that "all the high mountains everywhere under the heavens were covered". If this is taken to be an observation from God's perspective, then one will conclude that the Flood was necessarily global. But if it is taken as an observation from Noah's perspective, then all one can conclude from it is that all of the mountains within Noah's visible range (i.e., out to Noah's horizon in all directions) were submerged. This observation does not demand global coverage, as I will demonstrate below.

My entire analysis of the Flood to the present time has been based upon the view that it is Noah's observations which are recorded in Genesis 7 and 8, not God's, and I continue to hold to this view.

The pelagic Flood model is a "near-global" (neither "global" nor "local") model. Based upon the calculated height of the water in the Ararat region at the time of the Flood, and the assumption that this height must have been the same all around the globe (since "water seeks its own level"), I previously concluded that "in the pelagic Flood model Noah's Flood seems to have covered at least 99.6% of the earth's total surface area".[21] This conclusion is shown by the Antarctic evidence to be incorrect.

The pelagic Flood model worked well in the Near East, in the Ararat region, in Minnesota, in northern Canada, and in Greenland. But it appears to fail in Antarctica.

A brief look at the places just mentioned on a globe of the earth reveals that all of the successes of the pelagic Flood model are in the northern hemisphere, while its one failure is in the southern hemisphere.

I am led by this observation to propose a new model of the Flood, which I will call the hemispherical Flood model. The hemispherical Flood model postulates that only the northern hemisphere was flooded at the time of the Flood. Derivation and explanation of this model is the purpose of this issue of The Biblical Chronologist.

The Hemispherical Flood Model

In proposing a new model of the Flood I do not want anybody to get the idea that they should expect a new Flood model with every few issues of The Biblical Chronologist. If you review what I have written about the pelagic Flood model in previous issues you will find that I have always treated it as embryonic and incomplete. It was clear from the start that the pelagic Flood model was not the final answer. In contrast to this, I believe that the hemispherical Flood model is the final answer. I believe that it contains a complete description of the physical cause of the Flood. I further believe that from it one can, in principle at least, deduce the unfolding of the Flood with time at any point on the globe. Simply stated, I believe that the hemispherical Flood model properly corresponds to what actually happened at the time of the Flood.

I also do not mean to give the impression by my proposal of this new model that the pelagic Flood model must be entirely scrapped and we must go back and start everything over from scratch. In point of fact the hemispherical Flood model grows out of the pelagic Flood model and retains most of its features. The hemispherical Flood model still retains the 3520±21 B.C. date for the Flood, it is still a non-cataclysmic model, and it still retains the miles-deep ocean water in the Ararat region previously calculated. The only real difference is that it ascribes hemispherical, rather than near-global, coverage to the Flood.

Whence the Water?

This immediately answers several difficult questions. Most obviously, it answers where the water of the Flood came from and where it went—it came from the southern hemisphere of the earth, and it went back there when the Flood was over. If you look at a map of the earth, or better still, a globe, you will see that the southern hemisphere is dominated by ocean, while the northern hemisphere has a relatively high proportion of land. Evidently, quite a Flood can be gotten up in the northern hemisphere if all the water in the southern hemisphere is relocated to the northern hemisphere for a period of time.

But let me be a little more quantitative here. I have previously shown that the Flood reached a depth of about 2.5 miles above mean sea level today in the Ararat region. How deep would the water be if all of the water in the southern hemisphere were placed flat on top of the water and continents in the northern hemisphere?

The mean depth of the oceans is 3,800 meters. The mean height of the continents is 840 meters. The area of the continents is 1.49×10¹⁴ square meters. The area of the oceans is 3.61×10¹⁴ square meters. There is about 2.1 times more continent area in the northern hemisphere than there is in the southern hemisphere.

When I put this all together I find a depth of water in the northern hemisphere of about 2.1 miles above mean sea level. We can hardly expect exact correspondence with the Biblical expectation of 2.5 miles with such a crude approximation to the distribution of the water of the oceans at the time of the Flood (I will show the actual water distribution below), but it is clear that the hemispherical Flood model does put us immediately in the right ball park at least. The question of the source and sink of the water of the Flood is resolved.

Kangaroos and Similar Problems

Another problem which arises within a global or near-global Flood context but which does not arise within the hemispherical Flood model context is how the kangaroos got from Australia to the Ararat region and then found their way back home again after the Flood.

Fossils of kangaroos are evidently found only in Australia. This seems to establish Australia as their only home both before and after the Flood. If one assumes the Flood was global, then kangaroos must have been with Noah aboard the ark—otherwise they would all have been drowned by the Flood and become extinct. But this raises a difficult problem. How did kangaroos cross the ocean twice between Australia and Asia at the time of the Flood when they appear never to have succeeded in crossing it even once ever before or since?

Actually, the kangaroos are only a small example of a large class of problems of this type arising from the field of zoogeography. This class of problems is not limited to Australia, but it is best illustrated by that continent's odd and oddly assorted animals. Whitcomb and Morris, in their book The Genesis Flood, advocating a global cataclysmic Flood, explain:[22]

The marsupials of Australia consist of very distinct types which find their parallels among the placental animals. For example, there are marsupial moles, marsupial anteaters, marsupial mice, marsupial {squirrels} (flying phalangers), marsupial sloths (koalas), marsupial gophers (wombats), marsupial cats (dasyures), marsupial wolves (thylacines), marsupial monkeys, marsupial badgers (Tasmanian devils), strange lizard-like marsupials called bandicoots, and the rabbit-like kangaroos and wallabies. In addition, Australia boasts the only monotremes (egg-laying mammals) in the world: the duck-billed platypus and the spiny anteater.

On the assumption that the animals of the present world trace their ancestry back to those within the Ark, how can we explain the facts that these marsupials and monotremes are found nowhere in the world except in Australia and that the placentals never succeeded in reaching that sub-continent?

Whitcomb and Morris spend several pages discussing this problem, and then conclude:[23]

The more we study the fascinating story of animal distribution around the earth, the more convinced we have become that this vast river of variegated life forms, moving ever outward from the Asiatic mainland, across the continents and seas, has not been a chance and haphazard phenomenon. Instead, we see the hand of God guiding and directing these creatures…
This, of course, is an admission by Whitcomb and Morris that they have been unable to find any adequate answer to this problem within the sphere of natural phenomena.


The kangaroo problem does not arise within the hemispherical Flood model. Since Australia is in the southern hemisphere, it was not flooded at the time of the Flood. Thus the kangaroos did not need to seek safety with Noah—Australia's unique faunas were preserved in their native habitats.

Whence the Force Impelling the Water?

But the hemispherical Flood model immediately raises one or two obvious questions of its own. Why would the oceans of the southern hemisphere leave their basins and join with the oceans of the northern hemisphere? What impelled these waters to do this? How could the northern hemisphere be kept flooded to great depth for the better part of a year, while the ocean basins of the southern hemisphere were dry? Can any natural physical cause of such a thing be found?

In fact there does appear to be a natural agent by which such a thing can be brought about. To understand it, we must make a brief excursion into the fields of physics, geophysics, and astronomy.

Tidal Phenomena

The oceans are kept in their place today by the force of gravity. Since the earth is a sphere, the force of gravity points radially in toward the center of the earth everywhere. As a result the surface of the oceans is not flat, but rather is curved into the shape of a sphere also.

The ocean surface is routinely disturbed from its spherical shape by the tides. These result from the gravitational attraction of the moon and the sun. The tides demonstrate that the surface of the oceans does not need to conform to a perfect sphere. They are, in fact, bulges of large geographical extend on the surface of the oceans. In point of fact the water of the oceans simply obeys the law of gravity. The shape of the surface of the oceans is determined by the relative strengths of whatever massive bodies exist nearby to exert a gravitational pull upon the water.

The dominant gravitational force on the oceans today is exerted by the earth itself, because it is so massive and so close to (just beneath) the oceans. Hence the surface of the oceans is roughly a sphere. But the moon is pretty massive and not too far away, and its gravity exerts an appreciable pull on the oceans too. And the sun, while very much further away than the moon, is also very much more massive than the moon, so its gravitational pull on the water is also felt, distorting its surface from that of a sphere.[24]

Tides are very helpful in illustrating that the shape of the surface of the oceans is determined by gravity and does not need to conform to a sphere. Beyond this, however, tidal phenomena cannot help with the present problem. The difficulty is that tides always, necessarily produce two bulges at the same time on opposite sides of the earth. (Any elementary discussion of the origin of tides will explain why this is the case.) We are in need of a phenomenon which produces a single, very large bulge on one side of the earth only.

Remote Gravitational Attractor

But suppose the moon or a comet or some other astronomical object were to pass quite close to the earth. Could the gravitational attraction of such an object create the sort of bulge we require?

The answer here is also no. The difficulty is that the acceleration due to gravity is independent of the mass of the object being accelerated. This means that the solid earth would experience exactly the same acceleration due to the hypothetical astronomical object as the oceans. The oceans and the solid earth would move together in perfect concert toward the astronomical object. There would be no bulge.

We may thus conclude that the Flood was not due to gravitational attraction, tidal or otherwise, between the oceans and any imagined close encounter with some astronomical body. Evidently we must seek for the cause of the unusual distribution of the water of the oceans at the time of the Flood within the earth itself.

The Geoid

This takes us out of the realm of astronomy and into the realm of geophysics. And what we are discussing, in the jargon of the geophysicist, is the shape of the geoid.

The geoid is a very simple thing. It is simply the actual shape of the surface of the oceans due to the gravitational attraction of the mass (and rotation) of the earth alone—tidal effects are ignored. Geophysicists extend the oceans beyond their shorelines by constructing imaginary canals all through the continents. In this way one can talk about the geoid at every point on the surface of the earth, not just over the oceans.

Up until now we have been treating the geoid as if it were a perfect sphere. In actuality it is not a perfect sphere. It is, first of all, a somewhat flattened sphere, with the radius at the equator greater than that at the poles. This results from the rotation of the earth and the fact that the solid earth is itself flattened in this way. The bulk shape of the earth and the geoid is therefore a spheroid rather than a sphere. This flattening is not very interesting in the present context and I will ignore it in what follows.

Of much greater interest is the fact that the geoid does not conform to a perfect spheroid either. There are local hills and valleys on the geoid. What this means is that the ocean surface is not all at the same level; it has hills and valleys like the land (though not nearly as pronounced as mountains and valleys on land). For example, there is a valley in the surface of the ocean of very broad geographical extent which reaches a depth of 100 meters (330 feet) below the spheroid surface just south of India.[25]

These hills and valleys—or "warps", as the geophysicists call them—are caused by the fact that the distribution of mass within the earth is not uniform. Some regions are made of denser rock than others. Since the force of gravity is proportional to mass, and the mass of rock per unit volume varies from place to place on the surface of the earth, the force of gravity varies slightly from place to place over the surface of the earth as well. This produces geoid warps.

You might suppose that you could slide down the slopes of a geoid warp in a boat, but in fact you can't. If gravity could pull you down the slope of one of these hills or valleys in the surface of the oceans, it could also pull the water down the slope, and in that case the hill or valley would soon disappear. The hills and valleys exist because that is the shape the slightly uneven gravity over the surface of the earth, due to the uneven distribution of mass within the earth, has pulled the water into. Gravity is, in fact, everywhere perpendicular to the actual surface of the oceans (i.e., the force of gravity is everywhere perpendicular to the geoid). There is no component of the force of gravity parallel to the surface to pull you down the slope. And if you were on such a slope in a boat you would not feel that you were on a slope at all. Because gravity would be perpendicular to the slope, you would feel that the slope was level. This is so because vertical and horizontal are always relative to gravity. As the direction of gravity changes, so do horizontal and vertical. That is why people who live a quarter of the way around the earth from you do not feel like they are walking around sideways.

This is a little foreign to our everyday experience, and, therefore, a little difficult to grasp at first. But hills and valleys in the surface of the oceans—geoid warps—really do exist; they are not an imaginary thing of science fiction. They exist because water must obey the law of gravity which God has established.

It is important to grasp the reality and basic physical behavior of geoid warps before proceeding because we are about to see that a very large boat appears to have floated for about half a year on a very large geoid warp, and I don't want you to suppose that it would have slid down the slope of that geoid warp and crashed into the dry ocean bottom in the southern hemisphere.

Whence the Geoid Warp?

Now we must tackle the problem of how a geoid warp large enough to explain the Flood could possibly be produced.

First let me note that it is quite encouraging that geoid warps of 100 meters (330 feet) exist today. We have seen that the depth of the Flood in the Ararat region was about 13,600 feet above mean sea level.[26] Thus we need a geoid warp of about 13,600 feet. We only need to explain a factor of forty-one.

I have studied this problem pretty thoroughly and I can find only one possible solution. It requires that the inner core of the earth be displaced.

Earth's Insides

The earth is made up of layers, somewhat like an egg. (See Figure 1.) The part we are most familiar with is the crust. It is like the shell of the egg. It is quite thin compared to the rest of the earth, and it is solid. Beneath the crust is the mantle. It is also solid. Think of it like the white of a hardboiled egg. Beneath the mantle is the core. It is like the yolk of the egg. The outer core is liquid, like the yolk of an uncooked egg, and the inner core is solid, like the yolk of a hardboiled egg.

Figure 1: Scale cross-section of the earth.

The solid inner core is held in place in the center of the earth by gravity. The gravitational force responsible for keeping it on center results from the fact that its density is greater than that of the surrounding liquid. But just as a rock which is normally held in place against the surface of the earth can be picked up, so the inner core can, in principle, be displaced from its central position. The force required to do this is not small, but let us ignore the whole matter of how the inner core might be caused to be displaced for the time being and concentrate only on what will happen at the surface of the earth when the inner core is displaced.

Said simply, displacement of the inner core toward the North Pole will produce a positive geoid warp (i.e., a hill in the ocean surface) at the North Pole and a negative geoid warp (i.e., a valley) at the South Pole.

Said more elaborately, since the inner core is more dense than the surrounding liquid of the outer core, moving the inner core toward the North Pole will increase the total mass which is in the northern hemisphere of the earth and decrease the total mass in the southern hemisphere. Since the force of gravity is proportional to total mass, gravity at the surface of the earth will increase in the northern hemisphere and decrease in the southern hemisphere. The water of the oceans (and everything else on earth) will feel a slight but very real gravitational attraction toward the North Pole. The water, which is free to move, will flow toward the North Pole.

If the inner core were displaced toward the North Pole it would seem to an observer on the surface of the earth that the direction of horizontal had changed. Surfaces which were previously level would now seem to be tilting downhill toward the North Pole, even though they had not actually moved at all—the local gravitational field is all that would have changed. Water which had been standing on horizontal surfaces before the inner core had been displaced would flow "down" those surfaces toward the North Pole after the displacement. If you were standing on a beach which ran east and west during such a displacement you would see the water of the ocean suddenly begin to flow "up" the beach toward the North Pole. More accurately, you would feel that the ocean had tipped up and that the beach had tipped down so that the water of the ocean was suddenly being poured out across the beach.

Noah described it this way:[27] "On the same day all the fountains of the great deep [i.e., the ocean] burst open".

The Problem Solved

It is possible to calculate fairly accurately how deep the water would be around the globe for various displacements of the inner core using the equation for the gravitational potential. Figure 2 shows the results of my calculation.[28] In this figure I have plotted the depth of water versus degrees of latitude from the North Pole. Thus 0 degrees corresponds to the North Pole, ±90 corresponds to the equator, and ±180 corresponds to the South Pole.

Figure 2: Depth of the water of the Flood for various displacements of the inner core. Each depth curve is labeled with the corresponding inner core displacement in units of kilometers.

The depth of the water in this figure is relative to the normal ocean surface today. Notice that the vertical scale is greatly exaggerated relative to the horizontal scale. (The circumference of the earth—from -180 to +180 degrees—is about 40 million meters.) This gives the geoid warps shown artificially steep apparent slopes. In actual fact the steepest slope would only have been about 0.06 degrees, corresponding to an increase in depth of the ocean of about 1 meter per kilometer as one moved along the surface of the ocean toward the North Pole.

The dashed line at the bottom of the figure shows the ocean bottom. I have raised the ocean bottom in the northern hemisphere relative to the southern hemisphere to compensate for the excess continental volume in the northern hemisphere relative to the southern hemisphere.

The different depth curves shown result from displacements of the inner core from the center of the earth toward the North Pole. They are in steps of 250 kilometers displacement. The largest allowable displacement of the inner core is approximately 2,250 kilometers (2,258 kilometers according to the Preliminary Reference Earth Model). At this displacement the solid inner core contacts the solid mantle—it has hit the ceiling and can go no further. Notice that a portion of the southern ocean is completely dry at this maximum displacement.

I have also plotted the maximum depth of the Flood which I have previously deduced from the Biblical Flood narrative.[29] This is the horizontal dashed line at 4,145 meters (13,600 ft). It is immediately obvious that a Flood of sufficient depth to satisfy the Biblical narrative can be obtained in this way. The problem of how a large enough geoid warp could be produced is thus solved.

Whence the Displacement?

But now we must tackle the problem of how the inner core could possibly be displaced to such an extent.

I have given this question some considerable attention and, once again, I can find only one possible solution. It requires that the earth be impacted from space by some object of fair mass and high speed. Let me call this object a "space rock", for it was probably just a chunk of rock from space.

What would happen if a space rock plowed into the earth? From a physicist's point of view this is a very fine example of an inelastic, two-body collision. The important thing to bear in mind in such cases is that while kinetic energy is not conserved, momentum is. As a result of the conservation of momentum the space rock will impart a velocity to the earth.

Well, that's what it will do to the solid earth. The water on the surface of the earth, and the inner core down deep inside—neither of which is rigidly coupled to the solid earth—will prefer (because of inertia) to remain as they were before the collision. Thus the solid earth will take off in a slightly new direction while the oceans and inner core tend to stay behind. Consequently the inner core will be displaced relative to the center of the solid earth.

Let me try to clarify this with an example. Imagine you are standing on the end of a dock out over a still pond. Imagine that a small rowboat is floating motionless on the water several yards in front of you. Now you pick up a sizeable rock from the dock and throw it out over the water and into the boat. (We will assume the bottom of the boat is strong enough to sustain this abuse.) You see immediately that the boat has now acquired a velocity away from you. (The boat rapidly slows down because there is friction between it and the water, but the earth is in space where there is no friction and it just keeps going.)

Now we want to repeat the experiment, but this time we imagine that there is a croquet ball lying motionless on the flat floor of the boat, near the middle of the boat. You throw the rock into the boat once again (being careful to have it land near the front of the boat where it won't disturb the ball). You notice this time that the boat moves away from you as before, but the ball rolls slowly toward the back of the boat. It preferred to stay where it was in space rather than where it was in the boat. The inner core of the earth would behave in the same way.

How Far?

That is the basic mechanism which caused the inner core of the earth to be displaced at the time of the Flood. But how far was the inner core displaced?

Notice, first of all, from Figure 2 that it must have been displaced at least 1,800 kilometers. Any displacement less than this produces a Flood which is too shallow according to the Biblical criterion. Obviously, we are not talking about a small displacement.

But what is intriguing is that 1,800 kilometers, the absolute minimum displacement, is already 80% of the maximum possible displacement of 2,250 kilometers. Is it possible that the inner core of the earth was actually caused to collide with the solid mantle at the time of the Flood? Further analysis of Figure 2 suggests that it very likely was.

The vertical dotted line in the figure marks the location of Mount Cilo—the location where the ark probably came to rest according to our previous analysis[30]—relative to the North Pole. Notice that while a 1,800 kilometer displacement of the inner core produces a Flood which is deep enough at the North Pole, it does not produce a Flood which is deep enough at Mount Cilo. In fact, none of the depth curves is deep enough at Mount Cilo. What this is telling us is that the impact of the space rock was not centered on the North Pole.

Up until now I have treated the impact as if it were centered on the North Pole for two reasons. First, because it is clear that it must have been fairly close to the North Pole to explain its impact on such widely separated points in the northern hemisphere as Minnesota and Mesopotamia, and also to explain its dramatic effects on the ice sheets of the Arctic region.[31] And second, because it is already hard enough to communicate the basic physics involved without having to introduce the added complication of a latitudinal offset. But now it is time to be more rigorous.

Location of the Impact Center

We are obviously dealing with a very large impact. It seems reasonable to assume that if the impact center were located on any continental land mass, a very large crater would be conspicuous there today. As far as I can tell, no suitably large impact crater of suitable age is known. This implies that the impact center must have been in the ocean, rather than on land. Evidently the impact center should be sought in the Arctic or North Atlantic oceans.

I find (with a compass and a globe of the earth) that these oceans are about 33 degrees from Mount Cilo. Thus, the closest the impact center can be brought to Mount Cilo is 33 degrees. This is shown as the dashed vertical line in Figure 2.[32]

To get sufficiently deep water at this location implies a displacement of the inner core in excess of about 2,075 kilometers. This is now 92% of the way to collision with the mantle. Since this is a minimum displacement, collision of the inner core with the mantle seems quite likely. It appears, in fact, that the depth of the Flood recorded by Noah on Day 150 is directly related to this physical limit on how far the inner core can be displaced.

Myth?

It seems appropriate to pause for a moment here and reflect on just one thing. It now seems pretty clear that we have discovered that the Biblical Flood narrative is comprehensible in terms of displacement of the inner core of the earth. But what is most striking about this discovery is that it means that the existence of a solid inner core and a liquid outer core of the earth is embedded in and presupposed by the Biblical Flood narrative. Noah's observations cannot be explained apart from these concepts, while once they have been given it is possible to explain Noah's observations with mathematical precision. But these features of the interior of the earth have only been known to modern science for less than a century. Not even the most zealous Bible basher in academia would dare suggest that the Biblical Flood narrative originates any less, certainly, than two thousand years ago. If the Biblical narrative of the Flood is a myth, it is a mighty curious myth.

You will, no doubt, have noticed that I have understated my case. Not only must the existence of the inner and outer core of the earth be known to explain Noah's observations, but the fact that the earth is a sphere must be known, and the equation describing the force of gravity must be known, and Newton's Laws of motion must be known, and the volumes of water in the oceans of the world must be known, and the area of the continents must be known, and their relative distribution in the northern and southern hemispheres must be known, and their mean height above sea level must be known, and …. In fact, we have just seen that the very diameters of the inner and outer cores appear to be embedded in Noah's observations of the Flood.

The Impact Center

If, as now seems appropriate, we identify the 2,250 kilometer displacement curve of Figure 2 as being that which pertained on Day 150 of the Flood, then it is possible to invert the arguments above and arrive at the conclusion that the impact center could not have been located any further from Mount Cilo than about 40 degrees. This eliminates all but a 500 mile-wide strip of ocean stretching along northern Europe and northwest Asia. The Kara Sea is the most easterly extreme of this strip. The shape of the Kara Sea has much in common with an impact crater. Could this be the spot?

Deflection of Earth's Orbit

It is possible to calculate the approximate speed given to the earth by the impact. For the inner core to climb against gravity to the mantle requires 7.4×1028 joules of energy. The mass of the inner core is 9.8×10²² kilograms. This implies an initial speed of the inner core relative to the solid earth after impact of 1.2 kilometers/sec.

Since Earth's orbital speed is about 30 kilometers/second, the maximum deflection of the plane of Earth's orbit resulting from this new velocity component would be only about 2.3 degrees. We are clearly not talking about knocking the Earth completely out of its orbit or proposing anything astronomically extravagant. Orbital inclinations of a few degrees are not uncommon among the planets.

Whence the Space Rock?

That, in a nutshell, is the hemispherical Flood model. Displacement of the inner core of the earth as a result of an impact by a high energy rock from outer space appears to be the physical cause of the Flood. I hope to elaborate on this model further in future issues of The Biblical Chronologist. But there remains one more question to be answered in this preliminary report. How can the space rock be explained? Where did it come from?

Note first of all that when any sizeable rock from space falls onto land an impact crater is produced. This results from violent acceleration and rapid heating of the rock matrix lying in the immediate path of the space rock.

One would expect quite a "spray" of water from a space rock landing in the ocean, and probably an almost instantaneous conversion of a great deal of water to steam. Some unusual rainfall around the globe, in conjunction with the overflowing of the oceans resulting from the displacement of the inner core, would hardly be surprising.

Noah described what he actually witnessed in Mesopotamia this way: "on the same day all the fountains of the great deep burst open, and the floodgates of the sky were opened."[33]

Mass of the Space Rock

Once the speed given to the earth is known it is possible to calculate the momentum of the incoming space rock using momentum conservation. From there it is possible to compute the mass of the space rock if its arrival speed is known.

If the space rock was part of the solar system prior to impact (i.e., a captive of the sun's gravitational field—these are usually called "asteroids") then its arrival speed would be necessarily between the limits of 7 and 45 miles/second, with a most probable value of 20 miles/second.[34] The 45 miles/second figure yields a minimum mass for a space rock initially in orbit about the sun. I find 1.0×10²³ kilograms.

This mass is about 170 times larger than that of Ceres, the largest asteroid. It is, in fact, about 1.4 times the mass of the moon. Even if we assume a high (but possible) density of eight times that of water, the diameter of such an object would still be about 1,800 miles—nearly one quarter the diameter of the earth.

We have seen above that the impact center seems to be limited to a narrow strip of ocean no more than 500 miles wide. It is impossible to squeeze such a large object into such a narrow strip. Thus we are led to the conclusion that a much smaller object, traveling at a much higher speed, and therefore not bound by gravitation to the sun, was involved.

This conclusion also seems supported by contemplation of what an impact between Earth and another object one quarter of the size of the earth would likely do. It seems inevitable that such a collision would entail a tremendous cataclysm—yet Noah reports no such cataclysm, as we have previously seen.[35] A smaller object thus seems mandated.

In any event, a space rock not bound to the solar system prior to impact is clearly indicated, and this raises an interesting point. The probability that a space rock should collide with the Earth on a one-time pass of the solar system seems extremely remote. The earth is very, very tiny relative to the size of the solar system.

Picture the solar system as a target. The orbit of Pluto about the sun is the outermost ring of the target. The sun itself sits at the center of the target as the bullseye. What is the probability that a shot fired at random into the target will hit the earth? It is just the cross-sectional area of the earth relative to the cross-sectional area of the target. I calculate about one chance in nine hundred billion.

But, of course, this extreme improbability does not apply to the Flood, for the Genesis narrative makes it abundantly clear that the shot was not fired at random:[36]

And behold, I, even I am bringing the flood of water upon the earth…

The Biblical Chronologist is a bimonthly subscription newsletter about Biblical chronology. It is written and edited by Gerald E. Aardsma, a Ph.D. scientist (nuclear physics) with special background in radioisotopic dating methods such as radiocarbon. The Biblical Chronologist has a threefold purpose:

  1. to encourage, enrich, and strengthen the faith of conservative Christians through instruction in Biblical chronology,

  2. to foster informed, up-to-date, scholarly research in this vital field within the conservative Christian community, and

  3. to communicate current developments and discoveries in Biblical chronology in an easily understood manner.

An introductory packet containing three sample issues and a subscription order form is available for $9.95 US regardless of destination address. Send check or money order in US funds and request the "Intro Pack."

The Biblical Chronologist (ISSN 1081-762X) is published six times a year by Aardsma Research & Publishing, 412 N Mulberry, Loda, IL 60948-9651.

Copyright © 1997 by Aardsma Research & Publishing. Photocopying or reproduction strictly prohibited without written permission from the publisher.

Footnotes

  1. ^  Professor of Near Eastern Archaeology and Anthropology, University of Arizona; previously Director of W. F. Albright Institute of Archaeological Research, Jerusalem.

  2. ^  Editor of Biblical Archaeology Review.

  3. ^  Hershel Shanks, "Is This Man a Biblical Archaeologist?" Biblical Archaeology Review 22.4 (July/August 1996): 62.

  4. ^  Luke 17:26,27; NASB.

  5. ^  Genesis 7:16.

  6. ^  Gerald E. Aardsma, "Chronology of the Bible: 5000–3000 B.C.," The Biblical Chronologist 2.4 (July/August 1996): 1–5.

  7. ^  Gerald E. Aardsma, "Research in Progress," The Biblical Chronologist 1.1 (January/February 1995): 6–7. Gerald E. Aardsma, "Research in Progress," The Biblical Chronologist 1.2 (March/April 1995): 6–8. Gerald E. Aardsma, "Research in Progress," The Biblical Chronologist 1.4 (July/August 1995): 6–10.

  8. ^  Gerald E. Aardsma, "Noah's Flood at Elk Lake," The Biblical Chronologist 2.6 (November/December 1996): 1–13. Gerald E. Aardsma, "Research in Progress," The Biblical Chronologist 3.1 (January/February 1997): 12–14.

  9. ^  Gerald E. Aardsma, "Research in Progress," The Biblical Chronologist 2.4 (July/August 1996): 9,10.

  10. ^  Gerald E. Aardsma, "Noah's Flood at Elk Lake," The Biblical Chronologist 2.6 (November/December 1996): 8,10.

  11. ^  Gerald E. Aardsma, "The Depth of Noah's Flood," The Biblical Chronologist 3.3 (May/June 1997): 1–10.

  12. ^  Gerald E. Aardsma, "The Depth of Noah's Flood," The Biblical Chronologist 3.3 (May/June 1997): 8.

  13. ^  Gerald E. Aardsma, "The Depth of Noah's Flood," The Biblical Chronologist 3.3 (May/June 1997): 9. Gerald E. Aardsma, "Noah's Flood at Devon Island," The Biblical Chronologist 3.4 (July/August 1997): 16.

  14. ^  Gerald E. Aardsma, "Noah's Flood at Devon Island," The Biblical Chronologist 3.4 (July/August 1997): 1–16.

  15. ^  A. J. Gow, S. Epstein, and W. Sheehy, "On the Origin of Stratified Debris in Ice Cores from the Bottom of the Antarctic Ice Sheet," Journal of Glaciology 23.89 (1979): 185–192.

  16. ^  S. Herron and C. C. Langway, Jr., "The Debris-Laden Ice at the Bottom of the Greenland Ice Sheet," Journal of Glaciology 23.89 (1979): 193–207.

  17. ^  A. J. Gow, S. Epstein, and W. Sheehy, "On the Origin of Stratified Debris in Ice Cores from the Bottom of the Antarctic Ice Sheet," Journal of Glaciology 23.89 (1979): 185.

  18. ^  A. J. Gow, S. Epstein, and W. Sheehy, "On the Origin of Stratified Debris in Ice Cores from the Bottom of the Antarctic Ice Sheet," Journal of Glaciology 23.89 (1979): 185.

  19. ^  S. Herron and C. C. Langway, Jr., "The Debris-Laden Ice at the Bottom of the Greenland Ice Sheet," Journal of Glaciology 23.89 (1979): 194.

  20. ^  Gerald E. Aardsma, "Chronology of Noah's Flood," The Biblical Chronologist 3.1 (January/February 1997): 6.

  21. ^  Gerald E. Aardsma, "The Depth of Noah's Flood," The Biblical Chronologist 3.3 (May/June 1997): 8.

  22. ^  John C. Whitcomb, Jr. and Henry M. Morris, The Genesis Flood (Philadelphia: The Presbyterian and Reformed Publishing Company, 1961), 81.

  23. ^  John C. Whitcomb, Jr. and Henry M. Morris, The Genesis Flood (Philadelphia: The Presbyterian and Reformed Publishing Company, 1961), 86.

  24. ^  The tides result from the differential pull of gravity across the diameter of the earth, not the direct gravitational attraction of the moon and sun. The reader will, I trust, appreciate that I am attempting to keep technical excursions to a minimum in glossing over such points.

  25. ^  George D. Garland, Introduction to Geophysics, (Toronto: W. B. Saunders Company, 1979), 164.

  26. ^  Gerald E. Aardsma, "The Depth of Noah's Flood," The Biblical Chronologist 3.3 (May/June 1997): 1–10.

  27. ^  Genesis 7:11.

  28. ^  I have used for the density of the core the numbers from the Preliminary Reference Earth Model, Appendix F of: Frank D. Stacey, Physics of the Earth (Australia: Brookfield Press, 1992).

  29. ^  Gerald E. Aardsma, "The Depth of Noah's Flood," The Biblical Chronologist 3.3 (May/June 1997): 1–10.

  30. ^  Gerald E. Aardsma, "The Ark on Ararat?," The Biblical Chronologist 3.2 (March/April 1997): 1–12.

  31. ^  Gerald E. Aardsma, "Noah's Flood at Devon Island," The Biblical Chronologist 3.4 (July/August 1997): 1–16.

  32. ^  Notice that we are now interpreting the "degrees" on the X-axis as degrees from the impact center, rather than degrees from the North Pole. Strictly speaking this is not proper because the elevated ocean floor must remain centered on the North Pole rather than moving with the impact center. But the displacement of the impact center from the North Pole seems small enough to ignore this at the level of accuracy afforded by this simple model.

  33. ^  Genesis 7:11.

  34. ^  Stanley P. Wyatt, Principles of Astronomy (Boston: Allyn and Bacon, 1964), 223.

  35. ^  Gerald E. Aardsma, "Research in Progress," The Biblical Chronologist 2.4 (July/August 1996): 9,10.

  36. ^  Genesis 6:17.


Volume 3, Number 6November/December 1997

Radiocarbon Dating Noah's
Flood

The day began as uneventfully as the thousands which had preceeded it. The sun, still hidden behind the hills of Moab, was slowly turning the dark sky a pastel pink. Viewed from the verdant oasis of En-Gedi, the intervening Dead Sea appeared a soft pink too. But then a line of gold appeared and slowly spread. The sun peeped above the hills at last, freely spilling its life-sustaining rays out across the land once again.

For the inhabitants of En-Gedi life was good—a pleasant succession of unclouded days filled with work and play. Soon the bleating of sheep and goats mingled with the happy shouts of children as friends and relatives went about their daily chores.

But just before noon a slight, yet prolonged tremoring of the earth began. People and animals could only stand with difficulty. For the better part of a minute they had to lean to the south to keep from falling over. But it let up at last, and with reassuring shouts of encouragement and light-hearted laughter the inhabitants resumed their activities. Earth tremors were frequent in this region and posed little threat to a people who lived mainly in tents. But what began as just a suspicion slowly grew into a certainty over the next several hours—one felt that the whole face of the ground was slowly but inexorably tilting down toward the north. Work and play ground to a halt as the inhabitants watched in anxious amazement as the southern basin of the Dead Sea slowly went dry, its waters flooding the shoreline all along the North.

And then they heard a roar, like the roaring of a swollen desert stream after a cloudburst, yet obviously bigger. It was coming from the south end of the Dead Sea. And even as they watched, a wall of churning water, mud, foam, and debris one hundred feet high raged into the empty southern basin from the Arava valley beyond. Instinctively men and animals alike turned and fled west, away from the Dead Sea and up into the hills.


He watched the spontaneous evacuation of the oasis from his lookout atop the cliff six miles to the south. His family were all around him. He had ordered them out of the cave and to the top of the cliff following the earth tremor earlier in the day. The rock ceiling of their cave dwelling was too dangerous to remain inside at such times. They had griped at him for the inconvenience at first, but as the ground tilted and then the raging wall of water had entered the south basin they had fallen silent. He knew they were frightened and were looking to him for protection and direction.

But he was too excited to think much about that just now. As he had watched the fleeing crowd of oasis-dwellers, an idea had slowly formed in his mind. It would be risky, but he was no stranger to risk. Nature seemed to be going a bit weird just now, but the elders had told of freaky things in the past—a hundred to one all would be back to normal by morning. A little daring and a little ingenuity could pay big dividends at such times. If he succeeded in his plan he would be fabulously wealthy and his troubles would be over. With a command to his eldest son to take the family up into the hills where he would join them later he untethered the donkey and set out for the oasis.

He arrived just over an hour later and found the oasis completely deserted. But he paused at none of the empty tents, hurrying directly to the now unguarded temple. Quickly tethering the donkey at the entrance, he brashly entered the sanctuary, with sandals yet on his feet. With a feeling of exultation he snatched a beautifully worked, gleaming copper standard from its pole and then another and another until he could hold no more. Back outside he loaded these into goatskin sacks which hung down on either side of the donkey. Working quickly he added armload after armload, returning repeatedly to the temple to scoop up anything and everything of value inside, without care or concern for what he damaged or broke in the process. Finally, when the temple had been picked clean, he set out for his cave, leading the donkey once again.

The going was uphill this time, more uphill than usual with the crazy tilting of the earth. The weight of the hoard dictated a slow pace and gave him ample time to worry. Though the Dead Sea had already risen to an unbelievable height, water continued to pour into it from the Arava. Where was all that water coming from and when would it stop?

He reached the cliff top above his cave dwelling at last, hot and sweaty. He noticed that great clouds were now forming to the north—highly unusual for this season. But he had little time to wonder. The water had entered the gorge long ago and was already half way up the cliff.

He dumped the treasure roughly from the donkey's goatskin sacks into a reed mat—part of a simple reed and rope elevator system he had designed for lowering large loads to the cave entrance below. He tied the rim of the mat shut with its straw ropes, and then secured the entire bundle in a rope harness. Carefully he lowered his treasure over the rim and out of sight.

When the proper length of rope had been let out he fastened what remained to a stake driven into the ground for that purpose. Then he began his descent along the narrow goat path which led to the entrance of the cave, leaving the donkey tethered above. At least the tilt of the earth made the cliff a little less vertical, and the path a little less precarious than usual.

Once inside his familiar home he felt a little more relaxed. Still he worked quickly. After he had dragged the bundled hoard inside and removed the harness he began to dig in the dirt floor at the north wall of the cave. Eventually his digging exposed a natural crevice in the rock. It needed just a little widening to fit the hoard. He noticed that it was growing darker inside the cave as he labored—clouds must have begun to cover the late afternoon sun.

Finally he paused, sweating profusely. In the silence he could hear the water lapping against the cliff outside the entrance of the cave. It couldn't be too far below now—its rate of rise was obviously increasing. Hurriedly he dragged the bundle over to the hole he had dug and slid it down. With considerable effort he shuffled and stuffed it into the waiting crevice. In the process the reed mat broke open and lustrous copper items spilled out into the crevice. But he had no time to care. Quickly he leaned a flat rock over the entrance of the crevice, and shoved loose dirt back into the hole.


After he had disappeared out the mouth of the cave all was quiet and still inside. The only sound was the gentle whisper of lapping water, now at the threshold, echoing around the empty walls. Moments later, as the first small trickle of briny water began to probe the cave floor, a torrential downpour broke outside.

The Cave of the Treasure

The Cave of the Treasure is located high in the face of a sheer cliff in the Judean desert, to the west of the Dead Sea. It can only be reached with the aid of ropes today, though remnants of a narrow path to the cave, descending from above, can still be discerned across the face of the cliff. From the top of the cliff to the cave entrance is a drop of about 150 feet. The floor of the gorge is yet another 750 feet below.

The archaeological crew, under the direction of Pessah Bar-Adon, had already invested one two-week season in 1960 excavating the floor of the cave. They had found that it had been inhabited over five and a half thousand years earlier, during the Chalcolithic. They had already unearthed rich finds from this period—objects made of clay, bone, stone, straw, leather, and metal as well as food remains and hearths. Because of the extreme aridity of the desert the state of preservation of the archaeological finds was excellent.

The second season had begun March 14, 1961. It would only last two weeks once again, and was now into its second week. The crew, including soldiers from the Israeli army responsible for the safety of the team, continued their meticulous, methodical removal of the dirt floor of the cave, recording each new find as it was unearthed. Most of the floor had been excavated to a depth of over five feet when there came a most unexpected and remarkable discovery:[1]

It was our custom to relieve from time to time those who worked in a cloud of dust inside the cave, by others who were working near its mouth. On that day it fell to the lot of one of the students, Ruth Pecherski, and one of the soldiers, Freddy Halperin, to relieve those working inside. After a short while they came upon a sloping stone covering a crevice. With hands trembling with excitement they started to take out, through a crack, a number of copper objects, all the while muttering breathlessly "there are more"!

In spite of our excitement and curiosity, we had to curb our impatience and to proceed with caution, since before moving the stone we had to widen the excavation carefully and to photograph and register every detail. It was difficult to tear ourselves away from the site. We worked until nightfall, when we were forced to leave and to postpone the removal of the objects until next morning, as it was dangerous to undertake the difficult climb out of the cave in complete darkness. This was a sleepless night for us all. We waited, drawn and tense, for the morning, and the break of dawn found us back in the cave.

It took us three hours to remove all the articles from their hiding place. We stood thrilled and excited at the site of the growing heap of objects, whose number and quality, strangeness and beauty of design aroused our wonder and admiration.

The archaeological team had, in fact, discovered a hoard of 429 objects, weighing some 320 pounds total, most of which were beautifully crafted of a copper/arsenic alloy (Figure 1).

Figure 1: The treasure as found. Notice the reed mat at right in which the treasure had been bundled. [Pessah Bar-Adon, The Cave of the Treasure (Jerusalem: The Israel Exploration Society, 1980), 15.]

The discovery came as a great surprise to the archaeological world. Copper objects had previously been found in Chalcolithic strata, but nowhere near the abundance and artistic level of this hoard. The archaeologists had known for decades that man first learned to smelt copper during the Chalcolithic.[2] Indeed, that is how the period had obtained its name: "chalco" referring to the earliest regular occurrence of copper implements in archaeological strata and "lithic" referring to the still abundant occurrence of stone implements. But what they had not known before the discovery of this hoard of objects was that the science of copper metallurgy had come to such an advanced stage within this period (Figure 2). David Ussishkin summarized the impact of the discovery this way:[3]

The articles portray the mastery of the Ghassulian [Chalcolithic] artisans in the manufacture of copper objects, and their discovery drastically changes the earlier idea that the manufacture of metal was still in its infancy during that period.

Figure 2: Copper/arsenic standard from the treasure. It is hollow along the center, apparently for mounting on a pole. [Pessah Bar-Adon, The Cave of the Treasure (Jerusalem: The Israel Exploration Society, 1980), 45.]

How had this hoard come to be concealed in this nearly inaccessible cave in the desert? What had the copper objects been used for? Where had they come from? These questions obviously beg answers, and the archaeologists have made some helpful suggestions, as we will see below. Our knowledge of the proper relationship of Biblical and secular chronologies of earth history affords us an even greater insight into the answers to these questions. I have already shared my view regarding them in the piece of historical fiction which opens this article.

But we must turn our attention from this fascinating copper treasure to something apparently more mundane, though, in fact, equally fascinating—at least to the chronologist. We must fix our attention on the rude reed mat in which the treasure was bundled when it was thrust into its hiding place (Figure 1). And also worthy of note is a piece of wood protruding from one of the copper objects, apparently the broken end of a pole or staff upon which the object had been mounted. The fascination of these organic items lies in the fact that they allow us to radiocarbon date Noah's Flood.

The Date of the Flood

I have previously proposed that the proper Biblical date for Noah's Flood is 3520±21 B.C.[4] Working with this date we have been able to discover clear evidence of the Flood in the laminated sediments at the bottom of Elk Lake in Minnesota, and in the huge ice sheets of the Arctic.[5] Proceeding in a logically consistent way with this Biblical date has led most recently to the development of a comprehensive physical model for the Flood which immediately answers several difficult questions and promises to enormously enlarge our comprehension of this historical event.[6]

But what about radiocarbon dating? Does it support this Biblically derived date for the Flood and all that follows from it?

Radiocarbon

Strictly speaking, radiocarbon can only date objects, not events. To use radiocarbon to date an event, one must supply the radiocarbon technician with an organic (i.e., once living) object which has a known temporal relationship to that event. To date the Flood using radiocarbon we need to have some object which is known to have lived very near to the time of the Flood.

A piece of wood from the ark which Noah built would be quite good, though the possibility that the wood was cut some number of decades before it was used in the construction of the ark would add a potential complication. Radiocarbon can only determine the date when a sample was living, not when it was used in a particular building project.

Grain from the ark would be better. Grain is a consumable which is not generally stored for more than one or two years before it is used. Any grain found aboard the ark would very probably have been grown in the year immediately prior to the Flood.

Unfortunately, we have neither wood nor grain nor anything else from the ark, for remains of the ark—if they yet survive after five and a half thousand years—have never yet been found (claims to the contrary not withstanding). So we need some other sample which we have reason to believe grew just shortly before the Flood.

That is where the Cave of the Treasure mat comes in. It seems to meet this need admirably.

The Mat

The Cave of the Treasure mat is made of reeds. Reeds typically are harvested very soon after they have grown, and we would expect a mat made of reeds to have a relatively short service life. Thus, it is likely that the reeds which were used to make the Cave of the Treasure mat grew only a short time before the treasure was hidden away in its cave. Dating the mat should, therefore, provide a close estimate of when the treasure was hidden.

Now if it can be shown that the copper treasure was hidden in the cave just shortly before the Flood came, as I have pictured in my introductory historical fiction story, then the radiocarbon date of the mat should serve to radiocarbon date the Flood. What grounds are there for supposing the treasure was hidden just prior to the Flood?

Relation to the Flood

The mat and its associated treasure are unequivocally from the Chalcolithic period—all archaeologists agree on this today. I have previously proposed that the Chalcolithic period in Palestine corresponds to the pre-Flood period of the Bible.[7] In the present context it is appropriate, in support of this identification, to draw attention to Genesis 4:22. This verse, from the pre-Flood period of Biblical history, reads (NASB): "As for Zillah, she also gave birth to Tubal-cain, the forger of all implements of bronze and iron". This clearly places the origin of metallurgy in the pre-Flood period, and we have just seen above that archaeology places this origin in the Chalcolithic. Thus the mat originates pre-Flood.

We have also previously seen that the Chalcolithic period in Palestine came to a sudden termination, accompanied by the complete disappearance of its peoples.[8] Archaeologists have observed this abrupt disappearance for decades, but they have been strangely hampered in their ability to explain how an entire civilization could have suddenly vanished. For example:[9]

And where did all the know-how, sophistication, and originality of the Chalcolithic people in so many realms of creativity go? Those who followed them seem to have started from scratch, with the exception of some basic ceramic forms. All that had been attained during the Chalcolithic period disappeared, never to return, and the following generations never reached similar achievements, not even after hundreds and thousands of years.

The Chalcolithic period thus remains a mysterious period from beginning to end. If no significant breakthroughs in appreciation of its true essence are forthcoming, we will be left only to contemplate its creations, admire them, and wonder who their creators were, how they lived, in what manner they interpreted the world around them, and why they finally disappeared from the stage of human history.

The Bible supplies the "significant breakthroughs" which archaeology needs to understand this period. It informs us in the most straightforward manner possible that the Chalcolithic world disappeared because it was swept away in a great Flood—Noah's Flood.[10] In other words, the Chalcolithic was terminated by Noah's Flood.

Once this is understood it becomes clear that if the Cave of the Treasure hoard was hidden at the very end of the Chalcolithic, then it was hidden just prior to the Flood. And the evidence that the Cave of the Treasure hoard was hidden at the very end of the Chalcolithic is compelling.

First, the highly advanced technological ability in metallurgy evidenced by the treasure supports the conclusion that the copper objects originated near the end of the Chalcolithic period rather than earlier on during this period when metallurgy does appear, in fact, to have been in its infancy.

Second, the stratigraphic evidence of the cave in which the treasure was found also implies that the treasure was buried later on in the Chalcolithic. It indicates that the copper hoard was deliberately buried by digging down through the deposits of the earlier Chalcolithic. The excavator of the treasure, Pessah Bar-Adon, recorded:[11]

There is no doubt that the treasure was hidden towards the end of the occupation of the cave in the Chalcolithic period. At that time, in order to gain access to the crevice, a pit was dug in front of it, starting from the top of the Chalcolithic deposits.

Further evidence results from efforts to answer the questions posed above: How had this hoard come to be concealed in this nearly inaccessible cave in the desert? What had the copper objects been used for? Where had they come from?

It must first be understood that such a hoard must have constituted considerable wealth in its day. It was, indeed, a treasure. Examination of the objects themselves, however, reveals no practical use for them. They would not have been functional for cooking or weaving or farming. The only rational explanation of their function which has ever been found is that they had been deliberately manufactured for use in religious ritual or as furnishings of a shrine or temple. Most of them have holes through them suggesting that they were meant to be mounted for display, on poles, for example. One was actually found with the end of the pole still in it, as noted above.

And indeed, a Chalcolithic temple, bare of all furnishings, was discovered by the archaeologists just six miles north of the Cave of the Treasure, at the En-Gedi oasis which overlooks the Dead Sea from the west. David Ussishkin of Tel Aviv University suggested, back in 1971, that here was a somewhat obvious coincidence—a temple without furnishings and a hidden hoard of temple furnishings without a temple, from the same period and located within six miles of each other. He proposed that the Cave of the Treasure hoard belonged to the En-Gedi temple.[12] There is no obvious reason not to accept this proposal.

Ussishkin attempted a reconstruction of the circumstances under which the treasure had been hidden. He observed that the archaeological data showed that the temple had been in use during a single, relatively brief period. It had come to its end, not as a result of deliberate destruction, but rather its ruin seemed due simply to "desertion" for some unknown reason. He noted that a similar "abandonment" of Chalcolithic sites was found everywhere in Israel, bringing that period to a close. He suggested the following reconstruction:[13]

When the decision to abandon the temple had been reached, the "priests" methodically assembled all the ritual equipment without leaving even one article behind, and left for good. They traveled only a few miles until they reached the Nahal Mishmar [Cave of the Treasure] cave, where they stayed for a while. There they decided to continue their journey, and, considering their future return to be certain, chose to leave the ritual equipment in the cave. They carefully wrapped the articles in a straw mat and hid them in a niche never to be seen again.

This reconstruction seems to me to have a number of defects, which is why I have provided an alternate reconstruction at the introduction to this article. For example, the objects were not found "carefully wrapped" in the straw mat when excavated, nor does the evidence support the suggestion that they had been "methodically assembled". Pessah Bar-Adon described what he found thus:[14]

Part of the artifacts were wrapped in a reed mat, measuring 0.80 × 1.20 m. Those found outside the mat probably fell out when the hoard was placed in the crevice. The artifacts were packed without any order, showing that they were hidden in a hurry.

Additionally, I cannot go along with the notion that the temple was "abandoned". Other archaeologists have used, "depopulated", to describe the end of the Chalcolithic, and what I know about the termination of the Chalcolithic from the Bible leads me to much prefer this term.

But these are details only. The important point, which both reconstructions agree on, is that the treasure was hidden away at the close of the Chalcolithic. This conclusion results from the archaeological evidence implying that the temple was in use up until it was depopulated, and the fact that depopulation appears as the signature of the close of the Chalcolithic everywhere in Israel.

The sum of the evidence, then, is that the treasure was hidden at the close of the Chalcolithic at the time of the Flood. Thus, the mat which the treasure was wrapped in should serve as an appropriate sample for radiocarbon dating the Flood.

Down to Work

After this somewhat lengthy preamble, we are ready to get down to work. We wish to use radiocarbon to date the Flood and thereby check our Biblical chronology work to the present time. If the mat originates at the close of the Chalcolithic (as the archaeological evidence seems to show) and if the Chalcolithic was terminated by the Flood (as the Biblical evidence seems to show) and if the proper date for the Flood is 3520±21 B.C. (as Biblical chronology seems to show) and if calibrated radiocarbon is a reliable dating method (as both theory and a great deal of practical experience seem to show) then the radiocarbon date of the mat should be in harmony with 3520±21 B.C. If, on the other hand, any of these things is not right, then there is no reason why the radiocarbon date of the mat should support the Biblical date.

It would be very nice, at this point, to be able to present the results of a modern radiocarbon analysis of the mat. Unfortunately, there do not appear to be any modern radiocarbon analyses of the mat. All I have been able to find are three analyses, by three independent labs, which were made about thirty-five years ago. This is not fatal to the present endeavor by any means, but it is unfortunate because a great deal of progress has been made in the science and technology of radiocarbon dating since its invention by Libby back in the late 1940's. It is certain that a much more definitive result could be obtained at present than was possible thirty-five years ago. Nonetheless, the thirty-five-year-old results are adequate for the present purpose, even if they are less than ideal. What do they reveal?

The Data

The mat was first dated by Isotopes Incorporated in 1961. That lab obtained 4780±100 radiocarbon years as the radiocarbon age of the mat.[15]

Now I must make a brief comment before proceeding to the second and third radiocarbon dates on the mat. If you are current in your understanding of radiocarbon dating then you know that "radiocarbon years" are not equal to calendar years. To get a B.C. date from the mat the "radiocarbon age" of the sample must be calibrated. The calibration procedure amounts to looking up in a table the calendar year in which tree-rings having the same radiocarbon age as the sample grew. This is standard practice for all radiocarbon dates on archaeological samples today. I will apply the calibration procedure to these radiocarbon ages below.

The mat was dated a second time by the British Museum in 1963. They found 5390±150 radiocarbon years.[16]

The third radiocarbon measurement on the mat was made by the U.S. Geological Survey radiocarbon lab in 1964. They obtained 4880±250 radiocarbon years.[17]

It is immediately apparent that the first and third determinations do not agree very well with the second one. This suggests that somebody may have made an error in the second determination. This would not be too surprising—radiocarbon dating involves an intricate procedure and it is quite possible for human error to accidentally enter into this procedure at times. That is why, as I have pointed out in the past, one should not place much confidence in a lone radiocarbon date. Radiocarbon dates should always be checked. Multiple determinations of the same or related samples by independent labs, as in this case, answers the need for such a check. The strength of such checks is that it is most unlikely for independent laboratories to arrive at the same result if they have all made various errors. Here, as is usual in science, reproducibility of results is taken as the necessary evidence of their general validity.

The difference between the second date and the other two leads me to suggest that the second determination contains an error and should be discarded at this stage. Before reaching a final decision on this, however, let me check this suggestion against one other sample.

As mentioned above, the treasure also contained a piece of wood from the end of a staff which was found broken off inside one of the copper objects. We know that this piece of wood grew before the treasure was hidden, but we do not know how long before. But because wood is more durable than reeds we would expect the wood to be either older than, or of about the same age as the reeds—not younger than the reeds.

The wood sample was analyzed by Isotopes Incorporated, also in 1961. The result for this sample was 4760±120 radiocarbon years.[18] This agrees, within the stated error limits, with the first and third mat samples, but it is considerably younger (630 radiocarbon years) than the second mat sample. This supports the suggestion that the second mat determination contains a human blunder of some sort, and I will eliminate it from further consideration on this basis.

Results

Figure 3 shows the probability distributions which result when these two mat samples and one wood sample are calibrated.[19] Radiocarbon cannot pin down a precise date for a sample; it can only indicate the probability the sample grew over some range of dates. The higher the probability distribution goes, the more probable it is that the sample grew at that time.

Figure 3: Probability distributions for the date of the reed mat and wood samples from the Cave of the Treasure hoard. The range of possible dates for the Flood computed via modern Biblical chronology (i.e., 3520±21 B.C.) is indicated between vertical dashed lines.

The radiocarbon results in Figure 3 imply that it is quite unlikely the Cave of the Treasure hoard was hidden any earlier than about 3750 B.C., or any later than about 3350 B.C. Said another way, radiocarbon dates the hiding of the treasure to roughly 3550±200 B.C.

An Important Technicality

Before leaving this figure I need to address one further technicality to make it clear that I have not overlooked it.

As best I can determine, none of the samples shown in the figure was adjusted for isotope fractionation. This is a subtlety which can alter a radiocarbon age by several hundred years. It can be corrected for by making suitable measurements on the sample at the time the radiocarbon measurement is made. This subtlety was only beginning to be appreciated back in the early sixties when these mat samples were measured, and the measurements necessary to correct for it were only rarely made back at that time. (Today these measurements are standard practice.)

It appears to me that the isotope fractionation affect is, in fact, small for these samples, allowing it to be legitimately ignored in the present context. To see this, note first of all that the isotope fractionation correction for wood is quite generally small (because the standard upon which the isotope fractionation correction is based is itself a wood sample). So the wood sample would very likely give essentially the same result as that which is shown for it in the figure were it to be corrected for the isotope fractionation effect.

The reeds are slightly more difficult. Berger has compiled a list of radiocarbon dates for a number of reed samples from Egypt which includes their isotope fractionation correction.[20] Two distinct groups appear in Berger's list: ones which need to be corrected by the addition of about 30 years to their radiocarbon age, and others which need to have about 230 years added to their radiocarbon age. If we were to add 230 years to the mat samples in Figure 3 the mat would then appear to be several hundred years older than the wood sample. As discussed above, it seems most unlikely that the wood sample is, in fact, several centuries younger than the mat. Thus I am led to conclude that the reeds used in the construction of the mat must be similar to Berger's first group, requiring little correction for isotope fractionation.

Note that the only way to entirely eliminate this uncertainty is to perform a modern radiocarbon measurement on whatever fragments of the mat still exist at the present time. I have begun to look into the feasibility of having this done because of the great significance of the date of this sample to Biblical chronology and to our understanding of the chronology and history of the earth.

Conclusions

The harmony between the radiocarbon dates of these Cave of the Treasure samples and the date of Noah's Flood which I have obtained from Biblical chronological data is immediately evident in Figure 3. This harmony is also made evident by a simple comparison of the respective dates: 3550±200 B.C. for the Cave of the Treasure hoard according to radiocarbon and 3520±21 B.C. for the Flood according to modern Biblical chronology. These two dates are indistinguishable.

This has a number of important implications.

First, and most obvious, the claim that the proper Biblical date for the Flood is 3520±21 B.C. is corroborated by radiocarbon.

Second, since this date for the Flood results from the new Biblical chronology, in which an accidentally dropped "one thousand" years are restored to 1 Kings 6:1, the new Biblical chronology is, once again, validated.

Third, the claim that the Chalcolithic in Palestine corresponds to the pre-Flood era in the Bible is substantiated.

Fourth, the claim that the Chalcolithic in Palestine was terminated by Noah's Flood is substantiated.

Fifth, the attack on the integrity of modern, tree-ring calibrated radiocarbon dating which is being promulgated in some Christian sectors is seen to be unwarranted. Notice that if radiocarbon dating were a capricious, unreliable methodology, three of four samples should not have given internally consistent results, as we have just seen above. Furthermore, the radiocarbon results should not have harmonized with the Biblical date in that case.

If there were some kind of conspiracy afoot to pick out only those radiocarbon results which agree with some predetermined time scale, as I have sometimes heard claimed, then why would one of the four dates, which were all reported in the same place by the same investigator, be obviously different from the other three? And how did these imaginary, black-hooded conspirators manage to pick just those radiocarbon dates which would harmonize so obviously with the new Biblical date for the Flood—which date they could not possibly have known anything about thirty-five years ago, and which event they have concluded is mythological only?

Sixth, a new era in the study of the Flood by conservative Christian scientists has opened. No longer are the date and nature of the Flood matters for speculation. Modern Biblical chronology places the Flood 3520±21 B.C., and secular chronological data from lake sediments, Arctic ice cores, and now radiocarbon all agree. Previous speculations—whether cataclysmic or tranquil, global or local—which place the Flood in history somewhere for certain, but nowhere in particular, must now give way.

Seventh and final, a new era has also opened for the secular academicians. The facts must now be faced that: 1. the Flood has been identified in secular history, and 2. its location on the time line has been secured using standard secular dating techniques. The Bible and the secular record bear unified testimony to the reality and the timing of this historical event. No longer can the informed yet unbelieving scholar rationally assert the myth that Noah's Flood is myth. ◇

Biblical Chronology 101

In the Volume 1, Number 6 issue of The Biblical Chronologist I summarized the "state of the subject" of Biblical Chronology at that time.[21] Substantial progress has been made on significant Biblical chronology problems in the twelve issues of The Biblical Chronologist which have gone to press since that summary. The early portion of the route of the Exodus has been found, pinpointing the time of the Exodus to precisely that predicted by the missing millennium thesis.[22] The traditional date of the Conquest of Jericho has been falsified by new radiocarbon results, leaving the new Biblical chronology date of that event as the only rational alternative.[23] The idea that Noah's Flood was an earth-shattering cataclysm has been shown to be incorrect,[24] while the Flood itself has been shown to have been a real event having world-wide geological impact.[25] The historical reality of the Flood has been further confirmed through study of polar ice sheets, and the date of the Flood predicted by the missing millennium thesis has been overwhelmingly confirmed by one of these ice sheets.[26] The physical cause of the Flood has been discovered,[27] and, in the current issue, harmony between radiocarbon and Biblical chronology regarding the date of the Flood has been demonstrated. Clearly, it is time to update the state of the subject.

State of the Subject

A time chart showing the current state of the subject is shown in Figure 4. I have included the time chart used in the earlier state of the subject summary as the leftmost column in Figure 4. This allows easy comparison. Once again: the "date" column on the left is purposely given in increments of 500 years; boundary lines between regions in the "state" columns are deliberately rounded to the nearest 500 years for the sake of simplicity; and regions are depicted as sharply bounded whereas there is some degree of gradation between them in actual practice.

Figure 4: The state of the field of Biblical chronology at present.

Known

The "KNOWN" region remains unchanged. By "KNOWN" I mean to imply that there is basic harmony between Biblical and secular chronology in this period, and also that reasonably accurate chronological information regarding this period is readily available in textbooks and standard reference works.

This region extends back from the present through Solomon, David, Saul, and Samuel. A tiny minority of academicians are currently trying very hard to demonstrate that the Biblical accounts of Solomon and David are mere fiction. They are, of course, being given high visibility in the liberal media.[28] But they have yet to show any evidence which disturbs the basically "KNOWN" character of this period in any way.

Recently Solved (1990)

The period from 1000 B.C. to 3000 B.C. reaches back into the time of Abraham. It includes the monumental events of the Exodus of the children of Israel from Egypt and the Conquest of Canaan. This period was solved by the discovery, seven years ago, that 1000 years are missing from the current text of 1 Kings 6:1.[29] Decades of confusion regarding the proper historical and archaeological settings of the Judges, Conquest, Exodus, and Patriarchs was immediately clarified by the discovery of this missing thousand years. The proper Biblical dates of these events—1000 years earlier than traditional Biblical chronology had assumed—have now been repeatedly confirmed using data from the field of Biblical archaeology.

The validity of the missing millennium thesis and the basic soundness of the Biblical chronology of this period which results from it are now beyond rational dispute. Unfortunately, few Bible scholars are even aware of this important chronological discovery and its happy implications for Biblical historicity.

Much work remains to be done in this period. While the ready harmonization of Biblical and archaeological data in this interval has been amply demonstrated, very many details yet remain to be investigated and harmonized. As a single example, the proper archaeological identification of the store cities, Pithom and Raamses, which the Israelites built during their enslavement in Egypt (Exodus 1:11) has yet to be seriously researched and clarified within this new chronological framework.

Recently Solved (1994)

This period takes us back into the life of Noah and contains the Flood as its most significant event for chronological purposes. While it was the "PRESENT FRONTIER" back at the end of 1995, it must now be regarded as solved. In particular, the date of the Flood has now been corroborated in a sufficient number of independent ways to leave the proper chronology of this period beyond rational dispute.

Strictly speaking, this period was solved with the discovery of the missing millennium in 1 Kings 6:1 back in 1990. It took four years for this to be realized, however, and for the thesis to be formulated that the new Biblical chronology (which restores 1000 years to 1 Kings 6:1) was already in essential agreement with secular chronology—that no further correction of traditional Biblical chronology was required. The major impediment to progress, besides the workload associated with the investigation of the new Biblical chronology in the more recent period, was conceptual. Specifically, having been led to conceive of the Flood as something quite different from what it actually was, it was difficult to know even how to look for the real, historical Flood within the secular data. It was four frustrating years before the simplicity of the truth finally dawned. Accompanying the investigation of the chronology of this period over the past several years has been a growing awareness of the true nature of Noah's Flood. This has, most recently, culminated in the pulling of the physical phenomena underlying the Flood from a vague region of blissful ignorance, guess, and fantasy into something science and the human mind can intelligently deal with. While this process of discovery has been accompanied by a certain sadness at the loss of traditional mystique, it has also occasioned great rejoicing because of the demonstration of the solid reality of the Flood which it affords in the face of current, rampant unbelief.

Present Frontier

The "PRESENT FRONTIER" of Biblical chronology research has now moved into the pre-Flood period. This takes us back to the creation of Adam and ultimately to the Creation of the physical universe. This has been a region of great difficulty and confusion for Biblical chronology in recent centuries. Here, for example, lies the "age of the cosmos" problem, with its dependent "young-earth versus old-earth" and "creation versus evolution" debates.

The thesis which will be guiding my immediate investigation of this period results from the experience gained in unifying the Biblical and secular chronological data pertinent to the Flood. Specifically, I will be assuming that no further adjustment to traditional Biblical chronology is needed beyond the restoration of 1000 years to 1 Kings 6:1. I will then be comparing the Biblical history of this period with secular history using established secular chronologies and dating techniques.

In some ways the task of unifying Biblical and secular chronologies for this period seems formidable. But I am encouraged by two considerations. First is the fact that the unification of Biblical and secular data bearing upon the Flood seemed an equally formidable task just a few short years ago, but now that problem is solved. Second is God's evident blessing on the work to the present time. ◇

Research in Progress

There are many available avenues for research at the present time. I am finding it necessary to skip over some things I would very much like to delve into. The present report gives one such example.

In Volume 3, Number 3 of The Biblical Chronologist I used the Genesis narrative of the Flood to produce a graph of the depth of the Flood versus time. (That graph is reproduced here as Figure 5.) There I noted:[30]

It would be very nice if a theoretical functional form could be fit to these data points. Unfortunately, our present ignorance of the mechanism of the Flood leaves us without the necessary physical basis for such an attempt.

This limitation was removed with the publication of the hemispherical Flood model last issue. It is now possible to explain why this graph looks the way it does, and this is the purpose of the present report. While it is possible in principle to do this quantitatively and fairly rigorously via computer modeling, a very large investment of time would be required for me to do so. Hence the following discussion is largely qualitative. It is intended to provide some additional insight into how the Flood behaved and why it behaved the way it did.

Figure 5: Depth of the water of the Flood in the Ararat region, in thousands of feet, versus time. Error bars are ±3σ.

Dynamics of the Inner Core of the Earth at the Time of the Flood

We now know that the fundamental mechanism controlling the depth of the water during the Flood was the displacement of the inner core of the earth.[31] We have seen that there is a direct relationship between the displacement of the inner core from the center of the earth and the depth of the water at any point on the surface of the earth (provided only that the water is given sufficient time to come to its equilibrium configuration).[32]

Figure 6 shows, for example, the equilibrium configuration of the water of the oceans in the two extreme cases of 1. a centered, and 2. a maximally displaced inner core. The left diagram in this figure shows the state of the earth and the oceans before the Flood began and after it was all over. The diagram on the right shows the state of the earth and oceans at the height of the Flood—on Day 150 of the Flood, for example.

Figure 6: Scale cross-section of spherical earth under normal conditions (left) and at the height of the Flood (right). The heavy line is a scale representation of a 30 km thick crust. The depth of the ocean has been magnified 350 times relative to scale in both diagrams. The unequal distribution of continental volume in northern and southern hemispheres has been taken into account in the distribution of the ocean water.

I would now like to use this physical mechanism of the Flood to fill in and explain Figure 5.

The first question which must be asked is, "How long did it take for the inner core to reach maximum displacement?" Last issue I found an initial speed of the inner core after the impact of the space rock of 1.2 kilometers per second. As the inner core climbed against gravity toward the mantle its speed would have reduced. To determine an approximate length of time for the inner core to have reached the mantle, assume the average speed of the inner core was one half its initial speed. The distance it needed to travel was 2,250 kilometers. These numbers yield a characteristic time of just one hour.

If we assume that the fluid outer core also participated in the motion (as seems likely) then the initial speed of the inner core may have been slower. I find a characteristic time of about five hours in that case. In either case it is clear that the inner core reached maximum displacement very quickly relative to the overall duration of the Flood.

This means that the water of the oceans was experiencing the maximum possible gravitational attraction toward the impact center due to displacement of the inner core within just a few hours of the space rock impact. It does not mean that the water reached maximum depth in that time, however. The reason for this is that the water would have to flow from the southern to the northern hemisphere, and it takes time for water to flow from one place to another.

How long would it likely take the water to reach maximum depth? We can obtain a rough answer here as follows. First, note that each piece of water in the southern hemisphere would need to flow roughly one quarter of the way around the globe to get to its new location in the northern hemisphere. This is a distance of roughly 10,000 kilometers. Ocean currents are observed to flow as fast as 200 kilometers/day at the present time.[33] These numbers yield a characteristic time of 50 days.

This resonates immediately with the record in Genesis 7:17a that "the flood came upon the earth for forty days". It may be, in fact, that the water took forty days to come to its maximum depth and that it is this fact which Genesis 7:17a intends to convey.

In any event, once the water had reached its maximum depth it stayed there until Day 150. This implies that the inner core of the earth was kept in contact with the mantle for on the order of 150 days. This seems clearly to imply that the fluid outer core had been set in motion by the rising of the inner core and that its motion exerted a force on the inner core to hold it in place against the mantle.

The fluid of the outer core is believed to have a viscosity about one tenth that of water, so currents established within it could persist for a very long time. The idea of a strongly rising current up the center with more slowly falling currents along the core/mantle boundary suggests itself from the geometry. In that case the inner core would have been supported on the rising plume of core fluid.

This situation persisted until Day 150 when the inner core began to descend toward the center of the earth once again. Its descent would have been an inevitable consequence of the slowing of the fluid currents due to friction. As they slowed the drag force they exerted on the inner core would have diminished, allowing gravitational attraction to move the inner core back toward the center.

I previously observed that:[34]

it seems clear that the rate of recession of the water accelerated with time following attainment of maximum depth. Notice that the rate of recession was more rapid from Day 222 to Day 310 than it was from Day 150 to Day 222.
This can be explained by the inner core gaining speed initially as it fell. This is probably due to increased turbulence within the fluid, resulting from flow of the fluid entirely around the inner core once it had moved away from the mantle. Turbulence would dissipate energy and reduce the speed of the plume supporting the inner core.

Finally, it should be noted that it appears the inner core would not have overshot center. The descent of the inner core appears to have been governed at all points by a balance between the drag force of the fluid plume upward and the force of gravity downward. The inner core would have reached the center only as the drag force of the plume fell to zero. At that point there would have been no force or inertia to move the inner core further down. This means that no flooding of the southern hemisphere would occur as the Flood waned in the northern hemisphere, and no second pulse of flooding would occur in the northern hemisphere. The Flood would have decayed away monotonically.

Result

Notice that the behavior of the inner core breaks naturally into three regions following the impact of the space rock. First is a rapid rise (one to five hours) to the mantle. This is followed by 150 days of being pinned to the mantle by fluid core currents. This is then followed by a final descent back to the center of the earth lasting approximately 250 days.

The Flood itself also divides naturally into three physical stages, as shown in Figure 7. First is the waxing of the Flood, lasting probably forty days. It is due to the time required for the water from the southern oceans to flow into the northern hemisphere. Second is a period during which maximum depth was maintained, lasting on the order of 100 days. It is due to the inner core being pinned against the mantle. Third is the waning of the Flood, lasting roughly 250 days, due to the slow descent of the inner core back to the center of the earth.

Figure 7: The stages of the Flood explained. (The solid line through the data points is heuristic only.)

While all of this needs to be checked by quantitative computer modeling, it is apparent that the depth and timing of the Flood can be explained, at least in principle, by the hemispherical Flood model.

In closing let me note that while the foregoing discussion has focused on the role of the oceans in bringing about the Flood, the Biblical account is clear that there was also a great deal of rain at the time of the Flood. In this regard, notice that the atmosphere is held in place by gravity just as the oceans are. Thus its shape would have changed at the time of the Flood just as the shape of the oceans did. Great winds would necessarily have resulted as the entire atmosphere shifted northward at the beginning of the Flood, and then southward again as the Flood waned. When coupled with the atmospheric and hydrologic disturbances which were no doubt created immediately upon impact of the space rock, there is clearly plenty of room for the rain and wind of the Genesis account within the hemispherical Flood model. This, too, is in need of rigorous computer modeling, however, before definitive cause and effect relationships can be established. This is another area in which such studies promise to greatly enrich our comprehension of the nature of the Flood. ◇

The Biblical Chronologist is a bimonthly subscription newsletter about Biblical chronology. It is written and edited by Gerald E. Aardsma, a Ph.D. scientist (nuclear physics) with special background in radioisotopic dating methods such as radiocarbon. The Biblical Chronologist has a threefold purpose:

  1. to encourage, enrich, and strengthen the faith of conservative Christians through instruction in Biblical chronology,

  2. to foster informed, up-to-date, scholarly research in this vital field within the conservative Christian community, and

  3. to communicate current developments and discoveries in Biblical chronology in an easily understood manner.

An introductory packet containing three sample issues and a subscription order form is available for $9.95 US regardless of destination address. Send check or money order in US funds and request the "Intro Pack."

The Biblical Chronologist (ISSN 1081-762X) is published six times a year by Aardsma Research & Publishing, 412 N Mulberry, Loda, IL 60948-9651.

Copyright © 1997 by Aardsma Research & Publishing. Photocopying or reproduction strictly prohibited without written permission from the publisher.

Footnotes

  1. ^  Pessah Bar-Adon, The Cave of the Treasure (Jerusalem: The Israel Exploration Society, 1980), 7.

  2. ^  Pessah Bar-Adon, The Cave of the Treasure (Jerusalem: The Israel Exploration Society, 1980), preface.

  3. ^  David Ussishkin, "The "Ghassulian" Temple in Ein Gedi and the Origin of the Hoard from Nahal Mishmar" The Biblical Archaeologist 34 (1971): 37.

  4. ^  Gerald E. Aardsma, "Chronology of the Bible: 5000–3000 B.C.," The Biblical Chronologist 2.4 (July/August 1996): 1–5.

  5. ^  Gerald E. Aardsma, "Noah's Flood at Elk Lake," The Biblical Chronologist 2.6 (November/December 1996): 1–13. Gerald E. Aardsma, "Noah's Flood at Devon Island," The Biblical Chronologist 3.4 (July/August 1997): 1–16.

  6. ^  Gerald E. Aardsma, "The Cause of Noah's Flood," The Biblical Chronologist 3.5 (September/October 1997): 1–14.

  7. ^  Gerald E. Aardsma, "Research in Progress," The Biblical Chronologist 1.1 (January/February 1995): 7.

  8. ^  Gerald E. Aardsma, "Research in Progress," The Biblical Chronologist 1.1 (January/February 1995): 6–7.

  9. ^  Rivka Gonen, "The Chalcolithic Period," The Archaeology of Ancient Israel, ed. Amnon Ben-Tor (New Haven: Yale University Press, 1992), 80.

  10. ^  Unfortunately, the archaeologists are not paying much attention to the Bible anymore. They have concluded that it is myth and they have turned to "anthropological concepts" in search of explanations of their field data. They look with brooding shame at the forebears of their discipline who naively assumed the Bible had something valid to contribute to our understanding of the ancient past. If you have ever doubted that "the god of this world has blinded the minds of the unbelieving" (2 Corinthians 4:4a) then I encourage you to read a little in the technical literature of the present generation of "Biblical" archaeologists.

  11. ^  Pessah Bar-Adon, The Cave of the Treasure (Jerusalem: The Israel Exploration Society, 1980), 7.

  12. ^  David Ussishkin, "The "Ghassulian" Temple in Ein Gedi and the Origin of the Hoard from Nahal Mishmar" The Biblical Archaeologist 34 (1971): 23–39.

  13. ^  David Ussishkin, "The "Ghassulian" Temple in Ein Gedi and the Origin of the Hoard from Nahal Mishmar" The Biblical Archaeologist 34 (1971): 38–39.

  14. ^  Pessah Bar-Adon, The Cave of the Treasure (Jerusalem: The Israel Exploration Society, 1980), 15.

  15. ^  Sample number I-285. Pessah Bar-Adon, The Cave of the Treasure (Jerusalem: The Israel Exploration Society, 1980), 199.

  16. ^  Sample number BM-140. Pessah Bar-Adon, The Cave of the Treasure (Jerusalem: The Israel Exploration Society, 1980), 199.

  17. ^  Sample number WR-1341. Pessah Bar-Adon, The Cave of the Treasure (Jerusalem: The Israel Exploration Society, 1980), 199.

  18. ^  Sample number I-353. Pessah Bar-Adon, The Cave of the Treasure (Jerusalem: The Israel Exploration Society, 1980), 199.

  19. ^  Calibration was carried out using the decadal dataset of CALIB 3.0.3. (M. Stuiver and P. J. Reimer, "Extended 14C database and revised CALIB radiocarbon calibration program," Radiocarbon 35 (1993): 215–230. The decadal dataset is by M. Stuiver and B. Becker, "High-precision calibration of the radiocarbon time scale AD 1950–6000 BC," Radiocarbon 35 (1993): 35–65.)

  20. ^  R. Berger, "Ancient Egyptian Radiocarbon Chronology," Phil. Trans. Roy. Soc. Lond. A 269 (1970): 23–36.

  21. ^  Gerald E. Aardsma, "Biblical Chronology 101," The Biblical Chronologist 1.6 (November/December 1995): 8–10.

  22. ^  Gerald E. Aardsma, "The Route of the Exodus," The Biblical Chronologist 2.1 (January/February 1996): 1–9.

  23. ^  Gerald E. Aardsma, "Wood's Jericho Tumbles," The Biblical Chronologist 2.3 (May/June 1996): 1–6.

  24. ^  Gerald E. Aardsma, "Research in Progress," The Biblical Chronologist 2.4 (July/August 1996): 9–14.

  25. ^  Gerald E. Aardsma, "Noah's Flood at Elk Lake," The Biblical Chronologist 2.6 (November/December 1996): 1–13.

  26. ^  Gerald E. Aardsma, "Noah's Flood at Devon Island," The Biblical Chronologist 3.4 (July/August 1997): 1–16.

  27. ^  Gerald E. Aardsma, "The Cause of Noah's Flood," The Biblical Chronologist 3.5 (September/October 1997): 1–14.

  28. ^  See for example Biblical Archaeology Review 23.4 (July/August 1997): 26–42, 66.

  29. ^  Gerald E. Aardsma, A New Approach to the Chronology of Biblical History from Abraham to Samuel, 2nd ed. (Loda IL: Aardsma Research and Publishing, 1993).

  30. ^  Gerald E. Aardsma, "The Depth of Noah's Flood," The Biblical Chronologist 3.3 (May/June 1997): 6.

  31. ^  Gerald E. Aardsma, "The Cause of Noah's Flood," The Biblical Chronologist 3.5 (September/October 1997): 1–14.

  32. ^  Gerald E. Aardsma, "The Cause of Noah's Flood," The Biblical Chronologist 3.5 (September/October 1997): Figure 2, page 11.

  33. ^  George L. Pickard and William J. Emery, Descriptive Physical Oceanography: an Introduction, 4th (SI) enlarged edition (New York: Pergamon Press, 1982), 80.

  34. ^  Gerald E. Aardsma, "The Depth of Noah's Flood," The Biblical Chronologist 3.3 (May/June 1997): 6.


  Copyright © 2024 Aardsma Research & Publishing. All rights reserved.