 |
| Volume 7, Number 5 | September/October 2001 |
The Cause of Reduced
Post-Flood Life Spans – Part III
So at last Faramir and Éowyn and Meriadoc were laid in beds in the Houses of Healing; and there they were tended well. For though all lore was in these latter days fallen from its fullness of old, the leechcraft of Gondor was still wise, and skilled in the healing of wound and of hurt, and all such sickness as east of the Sea mortal men were subject to. Save old age only. For that they had found no cure…[1]
The Natural State of Material Bodies
For thousands of years it was believed that the natural state of a material body—a rock, an arrow, a wagon—was rest (i.e., no motion) at the surface of the earth. Though Aristotle (384–322 B.C.) seems to have been the first to formally record this idea, he was doubtless not the first to hold it. Nearly everything we are familiar with in common experience seems to corroborate this idea. When we throw a rock up into the air, it falls back to the surface of the earth and lies motionless there. If we shoot an arrow from a bow, it displays the same behavior. If we give a wagon a push on a level road, it quickly slows down and stops. If we would like the wagon to keep rolling, we find that somebody or something has to keep pushing it. In the everyday world about us, constant motion seems to require a constant force, and in the absence of such a force we observe that a material body quickly comes to rest.
Some two thousand years after the time of Aristotle, Galileo (1564–1642) performed a series of simple experiments which led him to a radically different view of the relation of force and motion. Galileo rolled a ball down an inclined slope, and watched as it rolled a short distance across the floor and then up an upward slope. He noted that the ball tended to rise to the same height above the floor on the upward slope as the height above the floor from which he had released it on the downward slope.
Galileo found this to be true regardless of the steepness of the incline of the upward slope. As the steepness of the upward incline was reduced, the ball traveled further along the incline before stopping and turning around, but it always came to rest and turned around at the same height above the floor from which it had been released.
Galileo reasoned that since the ball traveled further before coming to rest, as the slope of the upward incline was reduced, then the ball should go on rolling forever if the slope of the upward incline was reduced to zero. Obviously, if the slope of the incline was reduced to zero then the ball would never be able to achieve the height above the floor from which it had been released, and in that case it would have no reason to stop and turn around.
The obvious objection to Galileo's conclusion is that, in fact, when real balls are rolled across real floors they do not go on rolling forever. They slow down and come to a halt, as everybody has seen many times.
Galileo's response was that friction—the rubbing of the air and the floor boards against the ball—provided a force which opposed the motion of the ball and brought it to rest. He stated that in the absence of friction and other forces the ball would go on rolling forever.
Today every school child knows that Galileo was right. The natural state of a physical body is not rest at the surface of the earth; rather, its natural state is uniform motion in a straight line through space. This natural state is not easy to see at the surface of the earth because of the ubiquitous presence of forces such as friction and gravity which act upon material bodies there. But if we go away from the earth, out into space, this fact becomes readily apparent. In the space age it is a little easier for us to visualize this than it was back in Galileo's time. A space capsule requires rockets to boost it through earth's atmosphere and away from Earth's gravity field, but once it is free of earth the rockets can be turned off. The capsule will continue to move in a straight line without slowing the rest of the way to the moon, or however much further away its destination may be, because there is no air giving rise to friction in space.
The Natural State of Biological Bodies
There are several lessons which may be learned from Galileo's discovery. One lesson is that it is possible for ideas which seem proven a thousand times over by our everyday experience to still be false. Another is that common sense is not an infallible guide to truth. A third is that it is possible for an idea which has been held true by the near-unanimous consent of all of humanity for thousands of years to still be false.
These are all important lessons in the present context. My purpose in the present article is to unseat the idea that there is a natural time limit to life span—the idea that the natural state of biological bodies (mice, cats, humans) is to mature, age, and die within a time limit uniquely prescribed for each individual species. In place of this idea I advance the thesis that the natural state of biological bodies of all species is to mature and then go on living forever. In response to the obvious objection that real biological bodies are invariably observed to 'age' and die within a fixed life span, I reply that there is a certain 'biological friction' at work—the exact nature of which I hope to reveal in future articles in this series—which opposes the life of biological bodies and brings them to death. In the absence of 'biological friction' mature biological organisms will not 'age', and if other mortal forces (such as starvation or predation) are also absent, biological organisms will go on living forever.
The simplest, most precise way to illustrate my thesis is mathematically, so I will need to resort to some mathematical description this issue. Out of deference for the many readers of The Biblical Chronologist whose natural aptitudes and/or training do not lie in the field of mathematics I will, as usual, attempt to keep the mathematics to a bare minimum. I am hopeful that these readers may be able to glean the essential points from the figures and discussion in any case.
Survival Curves and
the Gompertz Function
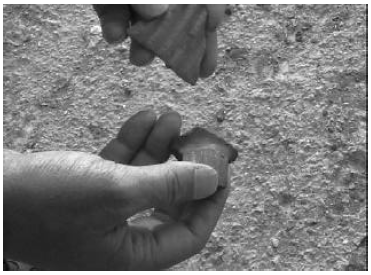
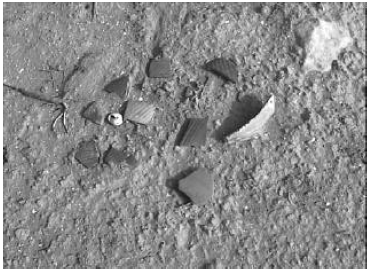
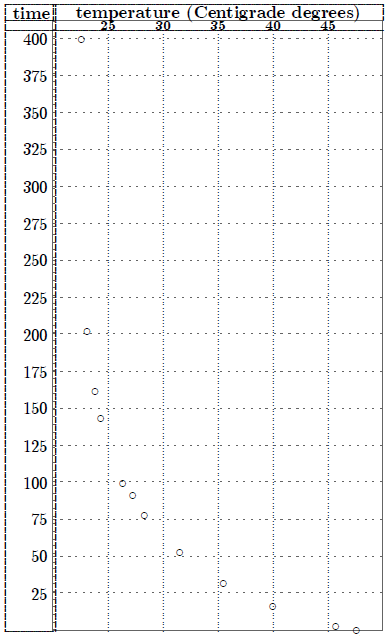
Figure 1 shows life span data for fruit flies ( Drosophila melanogaster).[2] To obtain these data, several hundred fruit flies, all of the same age, were raised together in a single chamber. Three times each week the fruit flies' food was changed, and the number of dead flies was counted and recorded. Figure 1 shows the percentage of flies still living as a function of time. Day zero corresponds to when the eggs giving rise to this group of flies were first deposited on culture media by parent female flies.
Figure 1: Survival curve data for fruit flies. The solid line drawn through the data points is a least squares fit of Equation 2.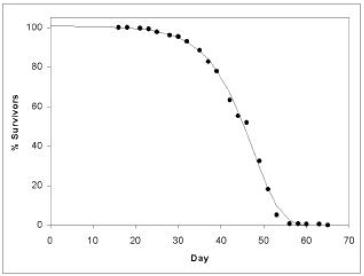 |
We call a graph of the Figure 1 type a survival curve. Survival curves show the percent survivors as a function of time for a population of organisms all of the same age.
Survival curves can be plotted for all species, including humans. When we plot such a curve for humans today we find that the shape is similar to that of Figure 1, though the time axis is much expanded, of course. This shape is, in fact, characteristic of well-cared-for organisms of most species. In popular terms, it reflects the fact that most individuals in such a population live a 'full' life before dying of 'old age'.
Survival curves are generally reasonably well-characterized mathematically by a Gompertz function. This function has the (differential) mathematical form:

where N is the number of survivors at time t, K is a proportionality constant, e is the exponential function, and A is an exponential growth constant.
A few simple observations may help give insight into the meaning of this equation. First, the left hand side of the equation, dN/dt, represents the number of individuals dying per unit time. It is just the death rate at any given time. The minus sign on the right hand side of the equation shows that the number of survivors decreases with time. Also on the right hand side of the equation, notice that at any time t, the death rate is proportional to N, the number of survivors up to that time. This is as it should be, of course; if one doubles the number of individuals in the group then the number of individuals dying per unit time (the death rate) should also double. Next notice that at t=0, the equation reduces to dN/dt = -KN, which can be rearranged as K = -1/N × dN/dt. The constant K is thus seen to specify the probability of death of an individual per unit time at t=0. If K is doubled the initial death rate will be doubled. Finally, the eAt part of the right hand side of the equation says that the probability of death per unit time increases exponentially with time. The constant A controls how quickly the probability of death increases.
Equation 1 is a separable differential equation. It is easily integrated to yield an expression for N as an explicit function of t. The result, for A ≠ 0 is:

I have graphed this equation in Figure 1 for N0=100, K=0.001 per day, A=0.159 per day, and taking t as zero at Day 16, the first day that all members of the group have emerged from pupation. The Gompertz function obviously does a good job of fitting real experimental data.
Other Solutions of
the Gompertz Function
The shape of the curve in Figure 1 reinforces the popular conception that there is a definite time limit on life span, beyond which no individual can reasonably be expected to live. The curve stays up near 100% survivors initially, but then it begins to fall off, and it continues to fall off ever more rapidly until only very few individuals of the original population remain. For the Figure 1 fruit fly data the death rate begins its dramatic increase after roughly day 30. For humans the dramatic increase in death rate begins after about age 55. As a result of the large increase in death rate, soon very few individuals of the original population remain, and these few survivors continue to dwindle until no survivors remain. In the case of the Figure 1 fruit fly population the time limit on life span appears to be 65 or 70 days; in the case of modern humans it is 125 to 130 years.
But the curve described by Equation 2 isn't the only possibility Equation 1 presents. There are two other possibilities of great interest in the present context.
Special case 1: A = 0
The first of these is the special case in which A = 0. Recall that A controls how quickly the probability of death increases. By setting A to zero, we do not allow the probability of death to increase with time. Rather, it is kept constant, as specified by the value of K.
For the case A = 0 we can no longer use Equation 2, as is immediately obvious by the fact that to do so would involve a division by zero. We must go back to Equation 1 and solve it over again, with A set explicitly to zero from the start.
Setting A = 0 in Equation 1 yields:

This is also a separable differential equation. It is easily integrated to yield the result:

This equation reveals that in the absence of accelerated probability of death (i.e., when A = 0) simple exponential decay of the population results. In this case an individual has the same probability of death at age 500 as they had at age 5. I will discuss this further below.
Special case 2: K = 0
The final case of interest to the present study is that in which K has a value of zero. In this case Equation 1 becomes:

This simple differential equation has the solution:

Equation 6 says that the number of survivors is always constant and equal to the number of individuals one started with. That is, nobody ever dies.
Interpretation
I have plotted the three curves resulting from Equation 2, Equation 4, and Equation 6 in Figure 2. I suggest the following understanding of these curves.
The curve resulting from Equation 6 (i.e., the horizontal straight line) is the natural state of biological organisms. This natural (immortal) state is not attainable in the world of this present reality because it is impossible to reduce K to zero for all time in the present physical world. Said in simple terms, one will die eventually, even in the absence of 'aging', due to car accident, or house fire, or murder, or drowning, or lightening strike, or cancer, or one or another of a great number of other potential causes of death. To realize this natural state our present perishable bodies must be somehow replaced by imperishable bodies. I am not saying anything new or radical in this last statement, of course. It has been clearly spelled out for several thousand years now:
Behold I tell you a mystery; we shall not all sleep, but we shall all be changed, in a moment, in the twinkling of an eye, at the last trumpet; for the trumpet will sound, and the dead will be raised imperishable, and we shall be changed. For this perishable must put on the imperishable, and this mortal must put on immortality. But when this perishable will have put on the imperishable, and this mortal will have put on immortality, then will come about the saying that is written, "Death is swallowed up in victory…" (1 Corinthians 15:51–54; NASB).
What I am saying which is new (and thus seems radical) is that the simple exponential curve, corresponding to Equation 4, is the one which should be regarded as normal for biological organisms in this present physical world, not the curve corresponding to Equation 2. Curve 2, I suggest, results only from pathology. Cure the pathology (or pathologies) and Curve 4 will result.
Demonstration
It is easiest to demonstrate this starting the other way around.
Imagine an experimental population of mice, all of the same age. Normally they begin to die off rapidly, due to 'old age' beginning around 80 weeks (one and a half years) of age, and are all dead by 165 weeks.
Let us back up to 20 weeks, when they are all still young and healthy. At this point we withdraw all food, but not water. That is, we induce the pathological condition known as starvation.
Figure 2: Theoretical survival curves for fruit flies corresponding to Equation 2, Equation 4, and Equation 6 of the text. Curve 2 is the same curve as is drawn through the data points of Figure 1. Curve 4 uses the same value for K as Curve 2. Notice that in this case roughly half of the flies are still living after ten Curve 2 life spans have expired.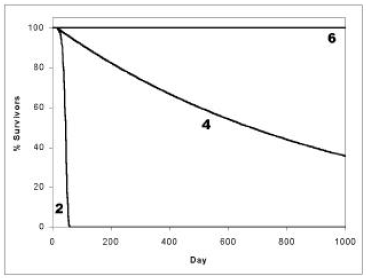 |
What will happen, of course, is that the mice will go on living for some relatively short time, but eventually they will begin to die of starvation. They will not all die at once, of course. Some will live a little longer than others because they had more body fat to begin with, or because they have a genetic makeup which is naturally more conservative of calories, or whatever. But it is a simple thing to see that, for the population as a whole, the probability of death will begin to rise exponentially from the moment food is withdrawn. This is just another way of saying that one will get a survival curve of the Curve 2 type.
One can repeat this thought experiment for whatever pathology one pleases. The result is always the same. At whatever point one introduces a pathological condition into the experiment the probability of death begins to rise exponentially, and if the pathology is not somehow alleviated a curve of type 2 ultimately results.
Notice that there will be a definite time limit to life span (a time beyond which no mouse can reasonably be expected to live) in this case. Having never done this to mice (and having no desire to do it) I don't know what the actual limit is, but let us suppose that no mouse can hope to live four weeks without food. Then the population will have reached zero (no survivors) by 24 weeks, well before the usual 165 weeks.
Now notice that if we take this same population of mice and withdraw food, not at 20 weeks but at 40 weeks, we get a curve of type 2, but this time the population begins to die off only after 40 weeks and are not all dead until 44 weeks.
We see immediately that though the introduction of the pathological condition introduces a very definite time limit on the life spans of the mice, there is nothing intrinsic about this time limit. We can get any life span we please merely by adjusting the time at which we stop giving the mice food.
Well, we can't exactly get any life span we please. We can't get a life span of 200 weeks, for example, because all the mice have died of 'old age' by 165 weeks. But it is precisely at this point that the Biblical life span data come in and help us to see our way through.
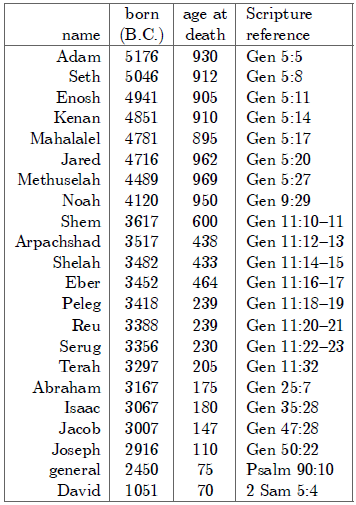
The Biblical data show us plainly that, for humans, death due to 'old age' can be adjusted to any value one pleases between the present average near 75 years out to the pre-Flood average near 925 years. Obviously then, there is nothing any more intrinsic about the age of death due to 'old age' than there is about the age of death due to starvation. Thus, not only are the shapes of the survival curves due to starvation and 'old age' similar, but also the fact of the non-intrinsic nature of the age at which they are evidenced is shared. It is surely but a tiny step to see that 'old age' is just another pathology—to see that Curve 2 is always the signature of some pathology acting, and that once all pathologies have been cured one will necessarily get Curve 4, which must then be regarded as the normal state for biological bodies in this present world.
Conclusion
There is no good theoretical reason from the field of biology why there should be a fixed time limit on life. Time itself is benign—it does not kill. Only disease and other mortal forces kill.
Clearly, death due to 'old age' is not something intrinsic to biological life. Progressive 'aging' culminating in death is not the natural state of biological bodies, including human bodies, any more than progressive slowing down and coming to rest is the natural state of physical bodies. Immortality (Curve 6) is the natural state, and random death (Curve 4) the practical reality one should expect in this present, fallen universe.
'Old age' (Curve 2) is just another pathology. (I have previously called it Malady X [read: malady X-bar].) It is a disease, the most serious disease faced by humankind today. The fact that all of humankind has lived with an acute case of this disease for 5000 years now, and gotten quite used to it, does not in the least mitigate its extreme seriousness or the urgency of the need to bring forward its cure—to which task I hope to turn in future articles in this series. ◇
Readers Write
Did Lamech Die in the Flood?
Dear Dr. Aardsma,
Thank you for The Biblical Chronologist. Each issue interests and provokes thought, even thoughts of the minor variety. It is one of these thoughts that I have in mind as I write today. In Volume 7, Number 4, under "The Data" heading you mention Lamech "who appears to have died in the Flood." You cite Genesis 5:31 as evidence as that verse says Lamech died at the age of 777.
Yes, Lamech did live to be 777, but he missed the Flood by five years. Lamech was 182 years old when Noah was born (Genesis 5:28). Lamech lived another 595 years after the birth of Noah (Genesis 5:30).
Noah was 600 years old when the Flood came (Genesis 7:6). If that is the case, Lamech already was dead and had slipped into his eternal rest five years before Noah, wife, three sons and their three wives entered the Ark.
J. E. Kuyper
Silver Lake, WI
Dear J.E.,
Thanks for pointing out this detail. I am sure I confused other readers with it as well.
I skipped over this detail because the purpose of my parenthetical comment about Lamech: "[who appears to have died in the Flood]" was to point out that he died of some other cause than Malady X ('old age'), so he should be excluded from the compilation of life span data of Table 1. (See original context.) The issue of precisely how he died was not the focus there, but let me focus on it briefly here.
I agree with the Biblical numbers you have presented, but feel the conclusion that Lamech died five years before the Flood is quite uncertain, and continue to feel that it is not unlikely (though also uncertain) that he died in the Flood.
My reason for this is rooted in the fact that the numbers found in Genesis 5 give evidence of having been rounded off (as is also true with many other Bible numbers of chronological importance). (I have previously discussed rounding of Biblical chronological numbers in Volume 1, Number 3, pages 1–2, and Volume 2, Number 4, footnote 6 on page 3.) Your calculation involves subtraction of two large numbers of nearly the same size, both of which may have been rounded up or down by five years. Such computations are well-known in science for producing imprecise (i.e., large relative uncertainty) results.
Notice the final digit in each instance in this exhaustive list of numbers from Genesis 5: 130, 800, 930, 105, 807, 912, 90, 815, 905, 70, 840, 910, 65, 830, 895, 162, 800, 962, 65, 300, 365, 187, 782, 969, 182, 595, 777, 500. Of these 28 numbers, 11 end in 0, 8 end in 5, 5 end in 2, 3 end in 7, and 1 ends in 9. None of these numbers ends in 1, 3, 4, 6, or 8. One does not need to do a probability computation to recognize that it is highly improbable that 28 integers, chosen at random, will have zero occurences of ending in five of the possible Arabic numerals 0 to 9. But for those who like probability calculations, I find that one can expect this sort of thing to happen less than four times in a billion tries. The evidence is pretty strong here that these numbers have been deliberately rounded off.
There is nothing wrong with rounding numbers, of course. These numbers were all certainly rounded to the nearest year at least—there is no way each of these individuals died exactly on the same day of the year they were born on, for example, and no reputable scholar would ever suggest that these numbers were meant to be understood as accurate to the very day. But it appears wrong to assume that these numbers have only been rounded to the nearest year. They show a strong preference for rounding to the nearest decade or half-decade, and a lesser preference for rounding to the nearest 2 or 7 (also separated by a half decade).
Again, there is nothing wrong with rounding. We do this in science all the time. We do it to avoid misleading others into thinking a measurement is more precise than it really is. For example, if I measure the length of the road from my house to my neighbor's house using my car's odometer, I will need to give the result to the nearest tenth of a mile—like this: 2.3 miles. If I measure it with a surveyor's tape I can be much more precise—like this: 2.2741 miles. Though the 2.2741 measurement is much more precise than the 2.3 measurement, both are valid statements about the measurement made; neither is wrong.
It appears to be an interpretive error to treat the numbers in Genesis 5 as if they were exact to the year. It is like saying Dr. Aardsma measured the distance to his neighbor's house to be 2.3 miles with his car's odometer, and he measured it to be 2.2741 miles with a surveyor's tape measure; therefore, the road between Dr. Aardsma's house and his neighbor's house is (2.3-2.2741=) 0.0259 miles longer when measured by car than when measured by surveyor's tape!
In actual fact the road is the same length no matter how one measures it—it doesn't grow or shrink depending upon which instrument one chooses to measure it with. The conclusion that it is 0.0259 miles longer when measured by car than when measured by surveyor's tape is wrong because it treats a measurement which has been rounded to the nearest tenth of a mile (2.3) as if it were precise to the nearest ten-thousandth of a mile (2.3000).
To know for certain whether Lamech died in the Flood we would need numbers whose precision extends at least to the nearest whole number of years. Genesis 5 does not appear to supply us with numbers having this level of precision.
You have subtracted the number of years Lamech lived after he became the father of Noah (595) from Noah's age at the coming of the Flood (600) to conclude that Lamech died 5 years prior to the Flood.

A scientist would immediately ask about rounding in these numbers. And we would all certainly want to grant at least plus or minus half a year. This transforms the computation to look as follows:[3]

But, judging from the list of 28 numbers given above, half a year underestimates the amount of round-off in these numbers. It is not at all clear what system of rounding was used with these numbers—bear in mind that it is far from clear even that they were initially recorded in a base 10 number system—so it is a little difficult to know just how much round-off to allow. I have previously proposed a standard ±5 years in an effort to cover the worst case.[4] Let me be a little more careful here.
In the present case one number ends in 0, suggesting the possibility of rounding to the nearest decade (i.e., ±5 years). The other ends in 5, suggesting rounding to the nearest 5 years (i.e., ±2.5 years). In that case the computation becomes:

Here the possibility that Lamech died 0 years before the Flood (i.e., that he died in the Flood), rather than 5 years before the Flood, is explicitly seen.
In addition to round off there is the whole matter of textual variants which also impacts this question. In the Septuagint—the version of the Old Testament most frequently quoted from in the New Testament—the pertinent number for Lamech is given as 565 years, rather than the 595 years found in the Masoretic Text and used above. This results in Lamech dying 35 years prior to the Flood. It would seem inappropriate for anyone to hold strongly to the conclusion that Lamech died five years prior to the Flood in the face of such uncertainties.
With such difficulties in mind, my statement, that Lamech "appears to have died in the Flood" might be expanded as follows: "Lamech died too young to have died of Malady X. We don't know why he died. It may have been some other illness, or he may have been murdered, or he may have encountered some accidental death. The Bible is silent on this. But it seems coincidental that Lamech alone, of all the pre-Flood patriarchs, would die prematurely, yet within round-off uncertainties of the Flood, and it seems curious that the Bible would fail to mention the cause of his premature death, unless the cause was already implicit in the narrative itself. These considerations suggest the possibility that the cause of his death may have been, in fact, the Flood. This seems to me the most probable conjecture we can make on this matter given the intrinsic uncertainties and limited information we have regarding it at present."
Gerald E. Aardsma, Ph.D.
Loda, IL
Research in Progress
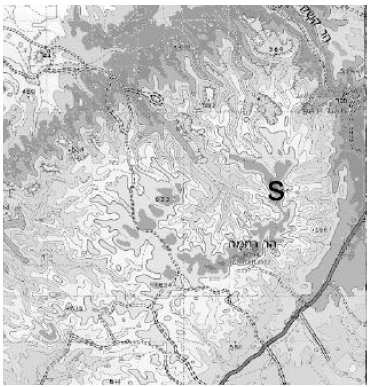
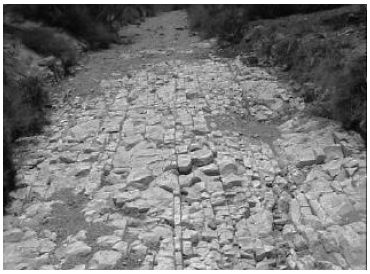
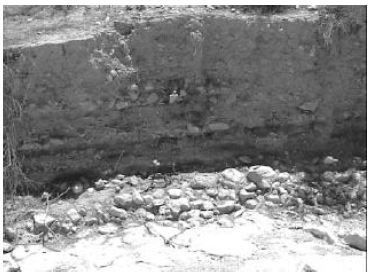
Ark Search
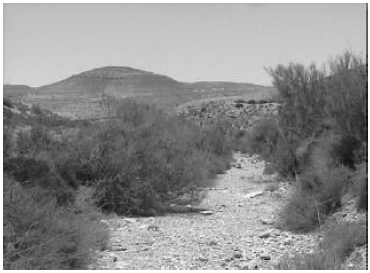
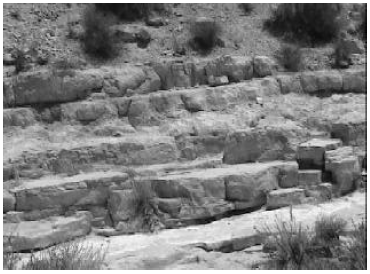
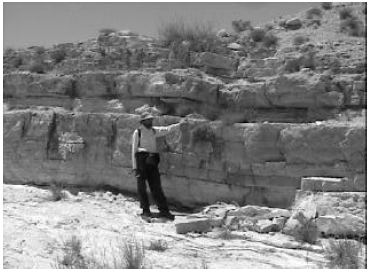
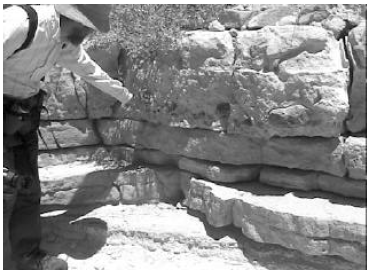
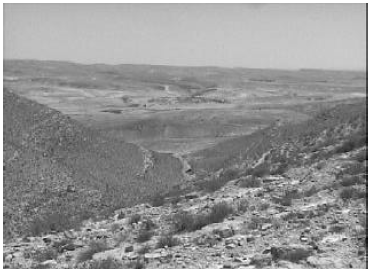
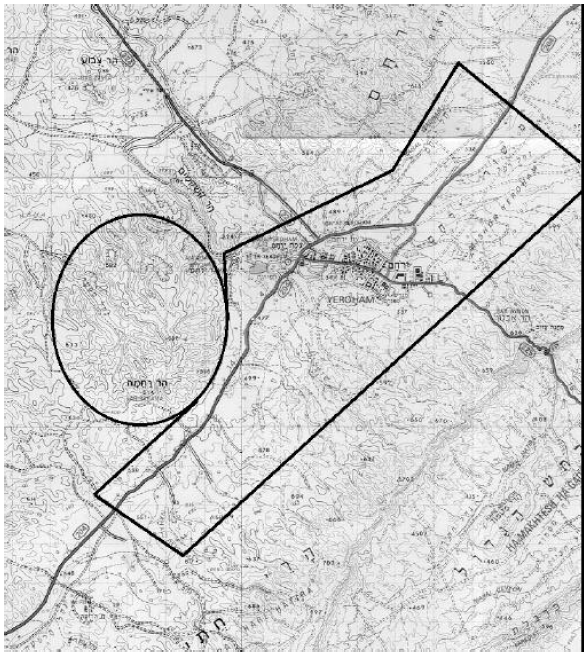
A review article giving background information for this research project can be found in The Biblical Chronologist, Volume 7, Number 3.
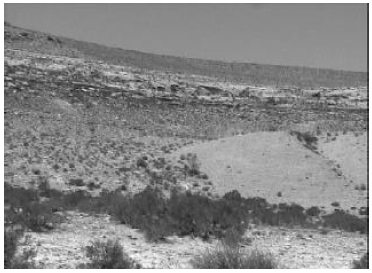
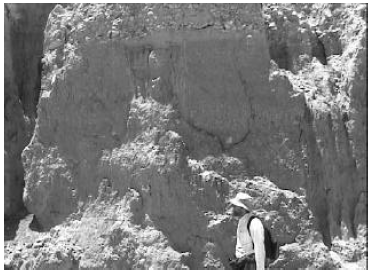
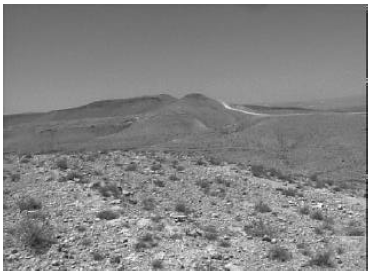
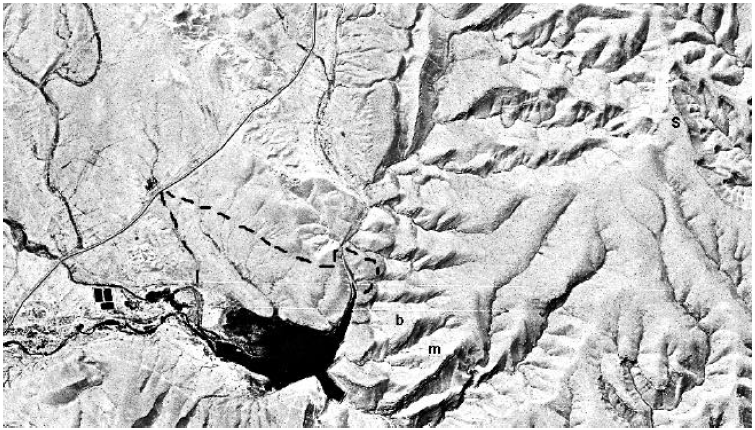
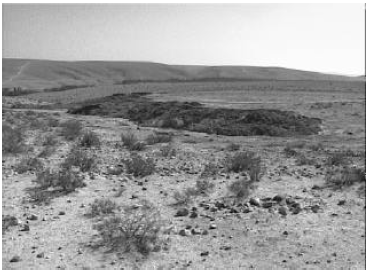
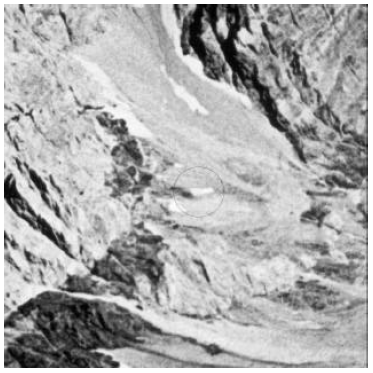
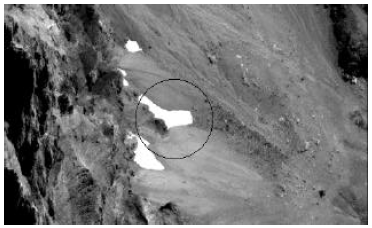
Figure 3: 1960's photo of IO3.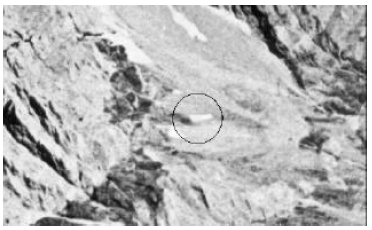 |
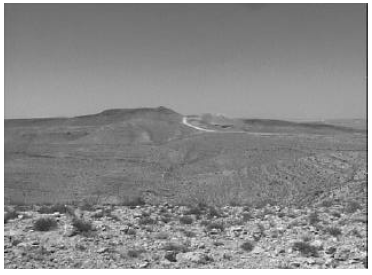
Figure 4: August 2001 photo of IO3.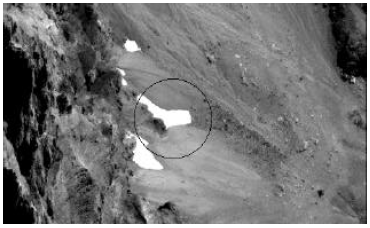 |
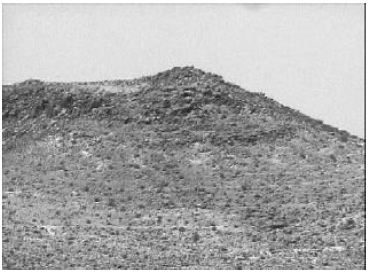
On August 10 we received one of the two images of Mt. Cilo ordered from Space Imaging over a year ago. A tiny segment of the overall image, showing IO3, is shown in Figure 4. The new image appears to be taken from the west, as was the case with the Figure 3 photo, but more overhead than the Figure 3 photo.
The most important observation from the new image is that IO3 is still there. Since the primary objective of obtaining a modern image was to answer this question, we may declare "success" in regard to this objective at this stage.
We are still unable to come to a definitive conclusion in regard to the ultimate question of whether IO3 is remains of the ark however. We had hoped that the better resolution of the newer cameras might help settle this question. The resolution of the new image is obviously much superior to the older photo. Notice the boulder field to the right of IO3 in Figure 4 for example. The focus is also excellent and the skies are clear of cloud. Unfortunately, there is more snow on the ground than we would prefer. IO3 has an "arm" of snow extending up the mountain, and the remaining outline of IO3 seems to be blurred by a blanket of snow. This amount of snow is not surprising for early August. But it renders the superior resolution of the new image of little benefit. Basically, it is difficult to tell very much about an object which is buried by snow no matter how good the resolution of one's camera may be.
A second image is due to be acquired before October 15. We can expect much less snow in that image whenever it has been successfully acquired. It should also offer a view of IO3 from yet another perspective. So there is potential of learning considerably more about the true nature of IO3 from this remaining satellite image. ◇
The Biblical Chronologist is a bimonthly subscription newsletter about Biblical chronology. It is written and edited by Gerald E. Aardsma, a Ph.D. scientist (nuclear physics) with special background in radioisotopic dating methods such as radiocarbon. The Biblical Chronologist has a threefold purpose: to encourage, enrich, and strengthen the faith of conservative Christians through instruction in Biblical chronology, to foster informed, up-to-date, scholarly research in this vital field within the conservative Christian community, and to communicate current developments and discoveries in Biblical chronology in an easily understood manner.
An introductory packet containing three sample issues and a subscription order form is available for $9.95 US regardless of destination address. Send check or money order in US funds and request the "Intro Pack."
The Biblical Chronologist (ISSN 1081-762X) is published six times a year by Aardsma Research & Publishing, 412 Mulberry St., Loda, IL 60948-9651.
Web address: www.biblicalchronologist.org. Copyright © 2001 by Aardsma Research & Publishing. Photocopying or reproduction strictly prohibited without written permission from the publisher. |
Footnotes
^ J. R. R. Tolkien, The Lord of the Rings (Boston: Houghton Mifflin Company, 1987), The Return of the King, 136.
^ These data were collected in 2001 from wild type Drosophila raised in the longevity research laboratory at Aardsma Research and Publishing.
^ The 0.7 is calculated as the square root of the sum of the squares of the two 0.5 uncertainties. All uncertainties are 3σ.
^ Gerald E. Aardsma, "Chronology of the Bible: 5000–3000 B.C.," The Biblical Chronologist 2.4 (July/August 1996): p. 3, footnote 6.